


The Lyrids 2026 campaign has ended.
We now move on to the Arietids and zeta Perseids, the strongest daylight meteor showers of the year. First discovered at Jodrell Bank Observatory in England in 1947, these showers occur when Earth passes through dense streams of meteoroids in space. Their peaks often overlap, and the parent bodies of both showers are still unknown.
Thank you for your support!
Results
Results for the Quadrantids 2022
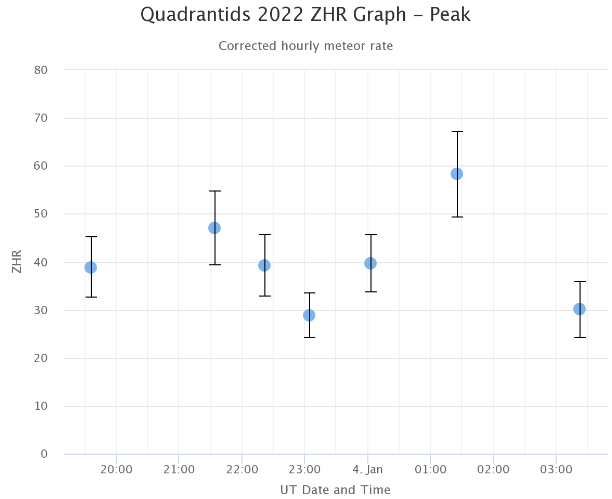
Between December 28 and January 12, you can observe the Quadrantid meteor shower. The zenithal hourly rate (ZHR) of this shower can be as high as that of two other reliably rich meteor showers, the Perseids in August and the Geminids in December. Yet Quadrantid meteors are not seen as often as meteors in these other two showers, because the peak intensity is exceedingly sharp, lasting only a few hours.
This year, the peak was predicted on January 3 at 20h40 UT. The maximum occurs just one day after the new Moon so that visual observers have observed it in good conditions. This is the activity plot of the visual observations (courtesy of IMO):
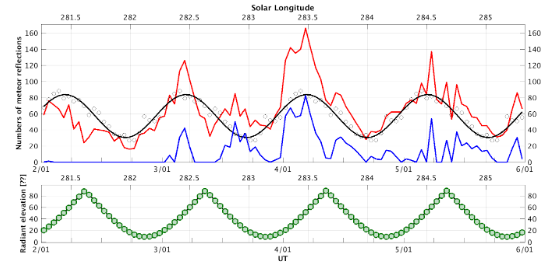
The plot below shows the activity curve for the BRAMS receiving station in Humain:
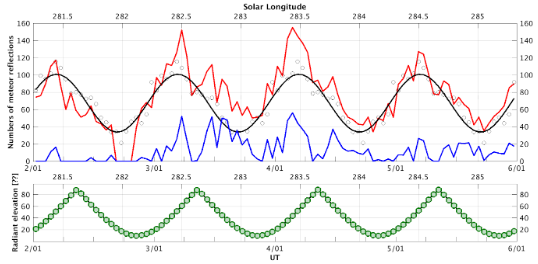
We have observed a similar activity curve in another BRAMS station, in Oudsbergen, which gives us confidence in the correctness:
Despite the low radiant position in the evening, it seems that we have observed the main peak on the evening of January 3. We observed a second peak in the morning of January 4. This peak is also visible in the visual observations.
Results for the Geminids 2021
The Geminids are a prolific meteor shower caused by the object 3200 Phaethon, which is thought to be an asteroid of the same type as 2 Pallas. This would make the Geminids, together with the Quadrantids, the only major meteor showers not originating from a comet.
The meteors from this shower are much slower (35 km/s) than most other meteor showers, can be seen in December and usually peak around December 7-17. The International Meteor Organization (IMO) predicted the peak on December 14 at 7h UT. This is without any doubt observed by the BRAMS network, as you can see in the plot below for the long duration (>10 seconds) radio meteors:
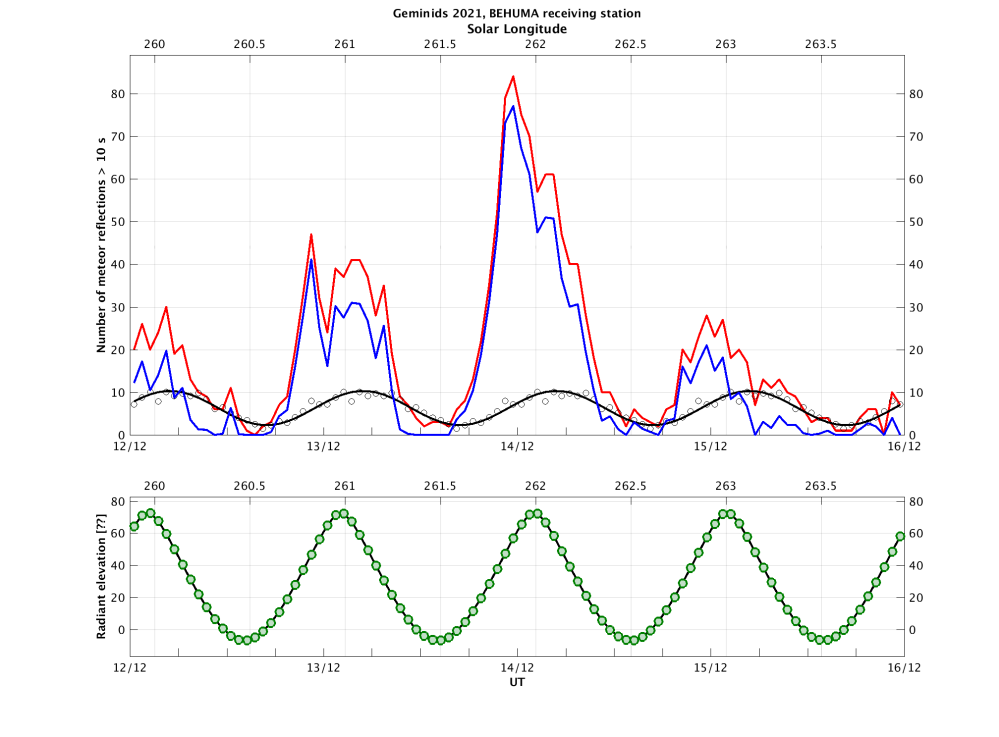
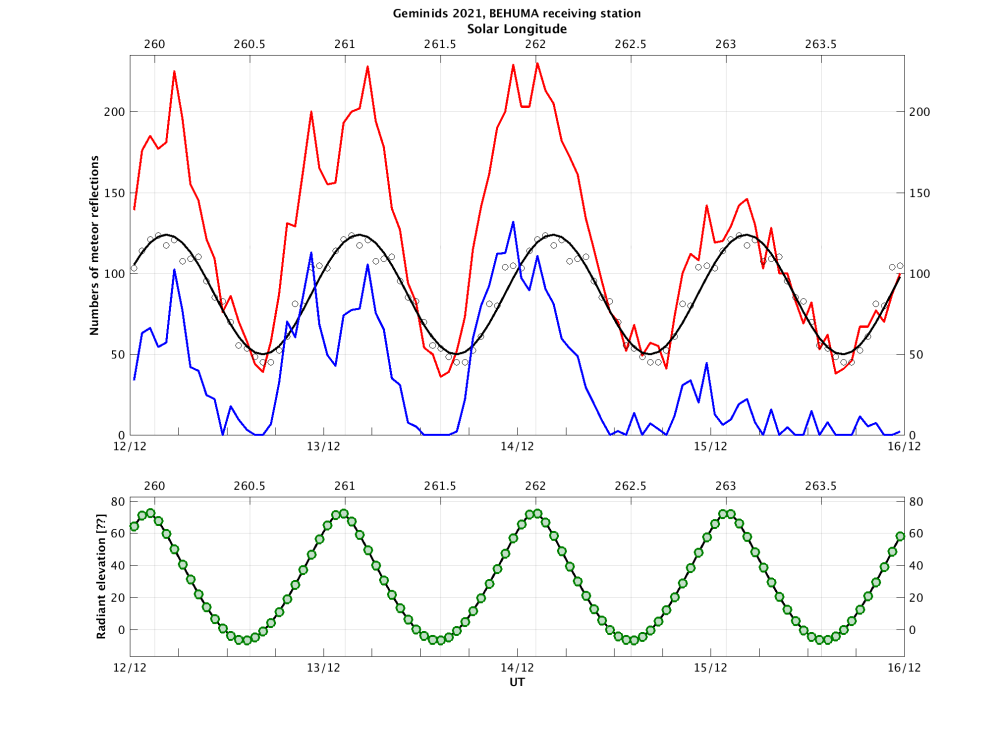
Radio techniques are more sensitive to smaller (fainter) meteors compared to visual observations. Mass-sorting within the stream means fainter meteors should be most abundant a day ahead of the visual maximum. Also this has been clearly observed in the BRAMS data, with a second peak in the morning of December 13:
Results for the Arietids & zeta Perseids 2021
The Arietids and the zeta Perseids are the most intense daylight meteor showers of the year. First discovered at Jodrell Bank Observatory in England during the summer of 1947, the showers are caused when the Earth passes through a dense portion of two interplanetary meteoroid streams. The Arietids and zeta Perseids maxima tend to blend into one another. The parent bodies of these showers are still under debate.
The plot below shows the total number of all radio meteor echoes registered from 4th to 11th June 2021:
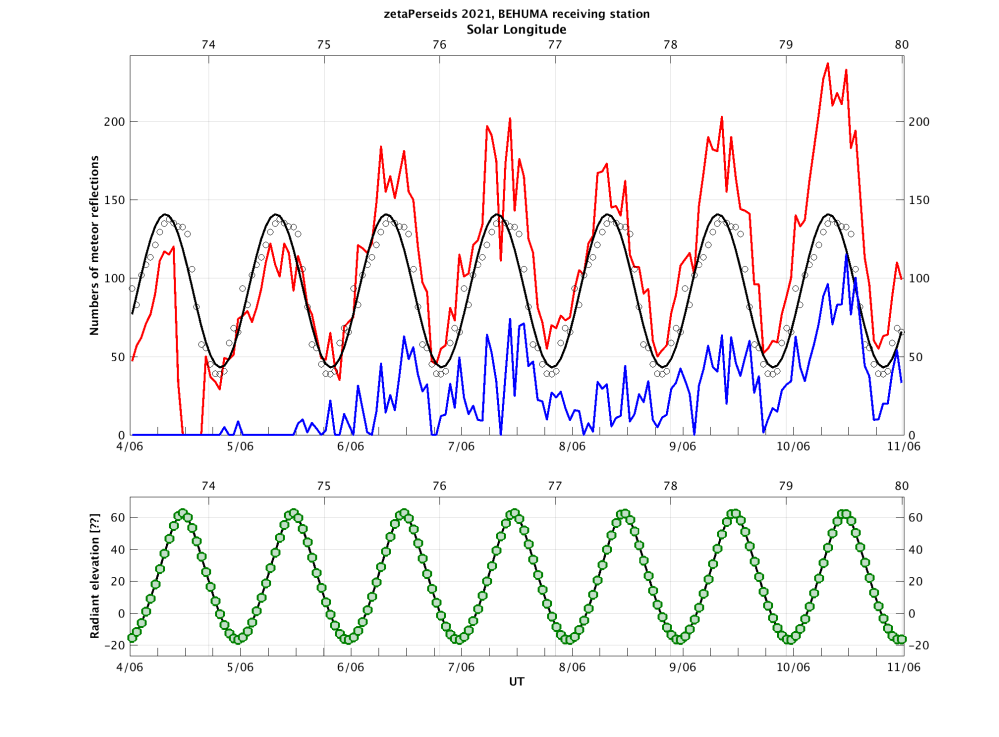
The peak of the Arietids was expected on June 7, which is in line with the BRAMS observations. The peak of the zeta Perseids was predicted for June 9, but the BRAMS network detected an even higher activity the day after.
Results for the Quadrantids 2021
Between December 28 and January 12, you can observe the Quadrantid meteor shower. The zenithal hourly rate (ZHR) of this shower can be as high as that of two other reliably rich meteor showers, the Perseids in August and the Geminids in December. Yet Quadrantid meteors are not seen as often as meteors in these other two showers, because the peak intensity is exceedingly sharp, lasting only a few hours.
In Belgium (~51° N) its radiant (the point from which they appear to hail) in the constellation Boötes is circumpolar (i.e. never goes below the horizon).
The meteoroid stream of the Quadrantids is recently linked to the comet 96P/Machholz 1 and the minor planet 2003 EH1 (likely a comet that has gone dormant in the past few hundred years). Scientists believe that the minor planet is responsible for the core activity (lasting ~0,5 days), while dust from the comet causes the broader, longer-lived (~4 days) background activity.
The peak was predicted for January 3, which is in line with the BRAMS observations:
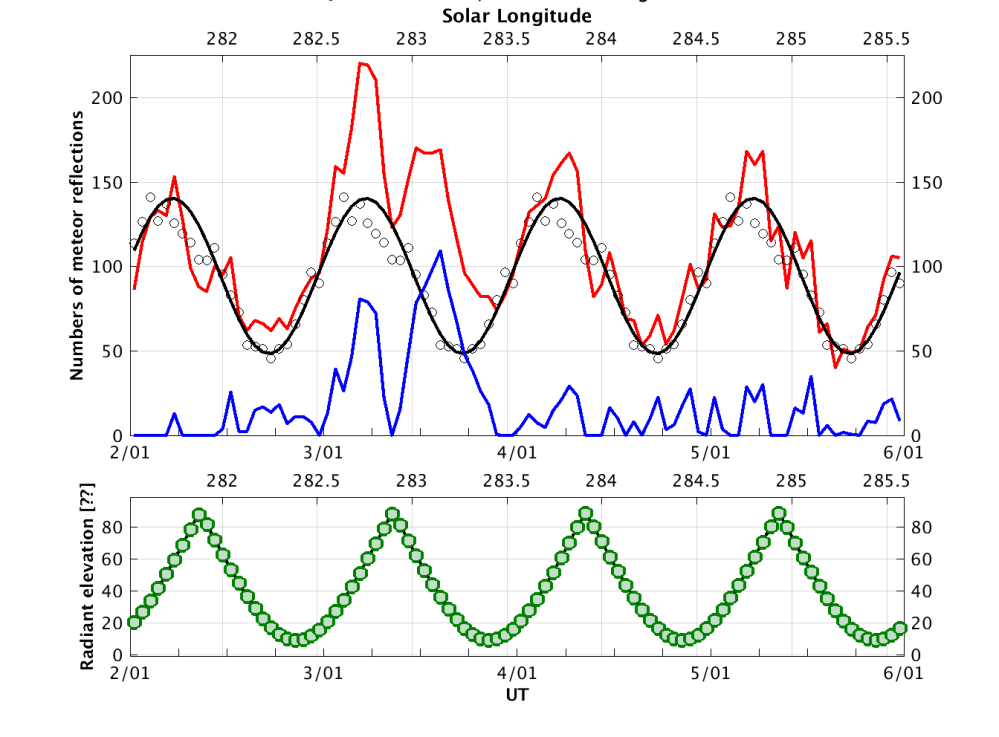
The sudden drop during the peak period has no physical cause, but is due to poor geometric conditions when the radiant is close to the zenith.
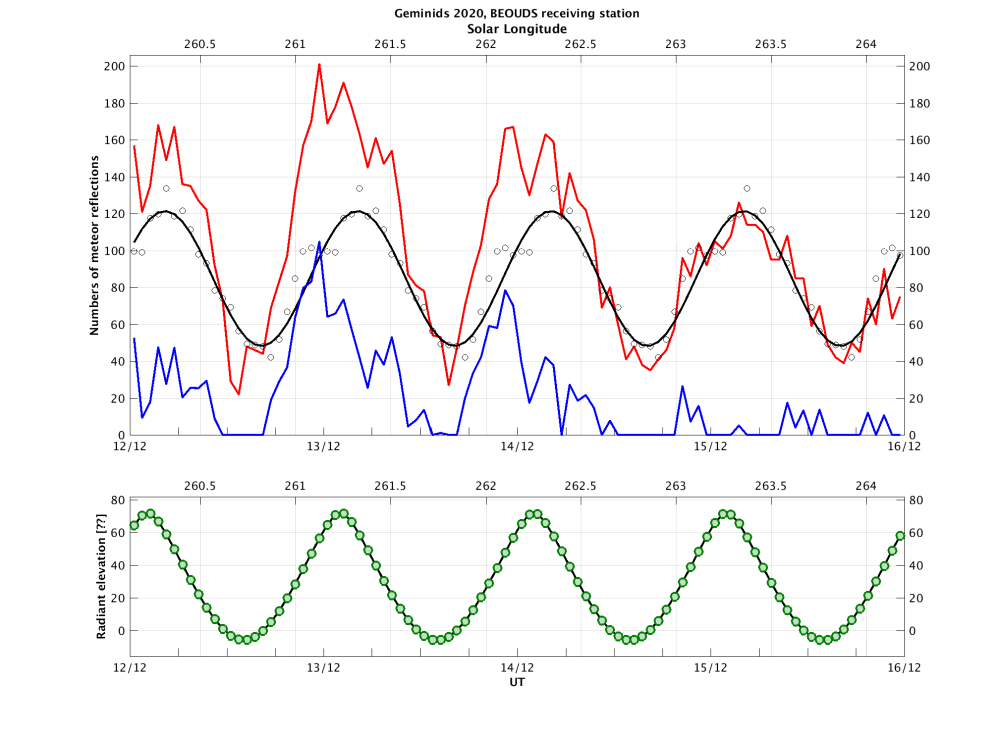
Results for the Geminids 2020
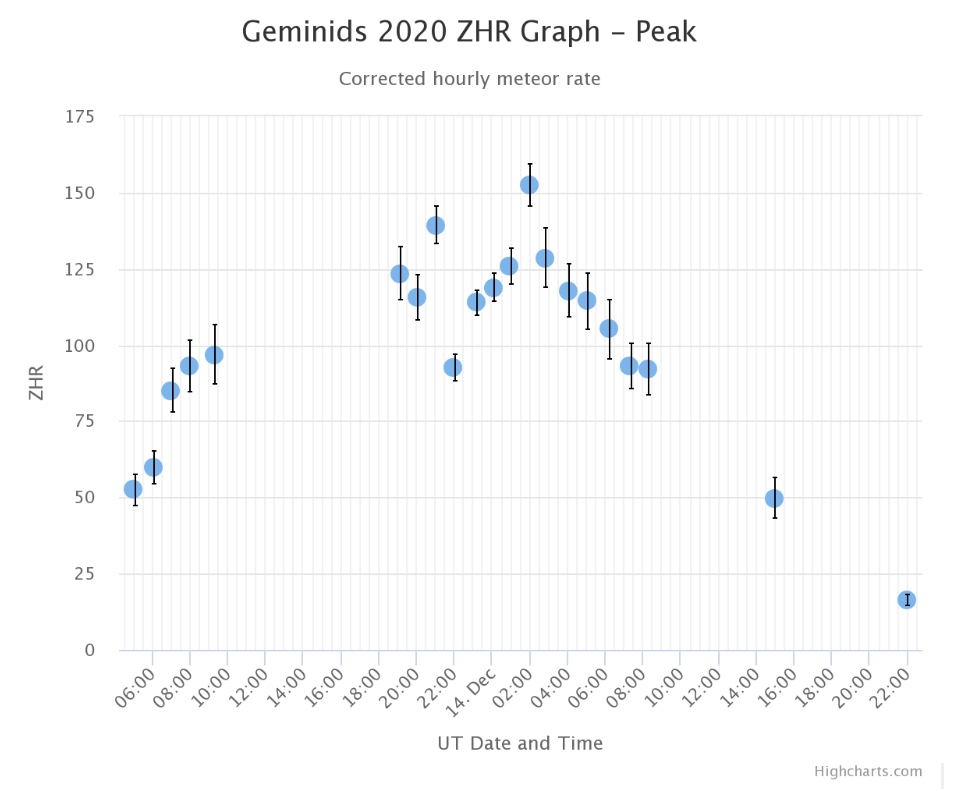
The Geminids are usually the strongest meteor shower of the year and meteor enthusiasts are certain to circle December 13 and 14 on their calendars. The Geminids are often bright and intensely colored. Due to their medium-slow velocity, persistent trains are not usually seen.
The moon was new on December 14 and thus created perfect viewing conditions for the best and reliable Geminid meteor shower (GEM) maximum on December 14 00h50m UT, with an expected ZHR = 150. The timing for the peak was favourable for European observers. Peak ZHRs were slightly increasing over the past years and now reach up to 140-150 levels. These are the results of the visual observations published by the International Meteor Organization (IMO):
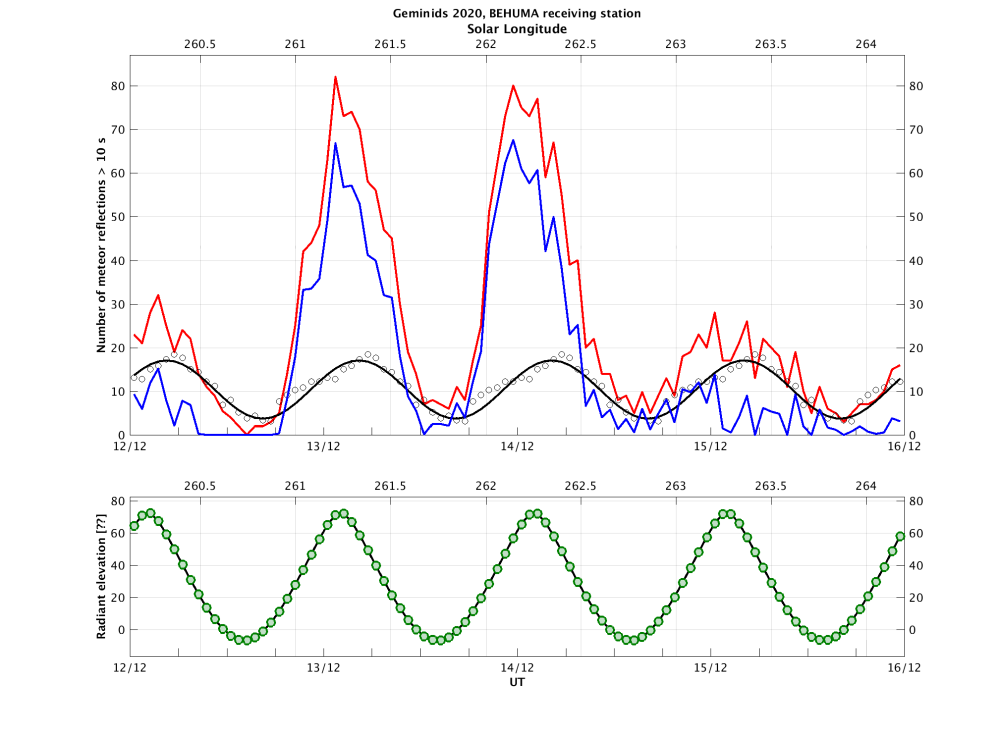
When we compare this with the long duration meteors observed by the BRAMS station in Humain, we see that there was a second peak on December 13, unfortunately during daytime:
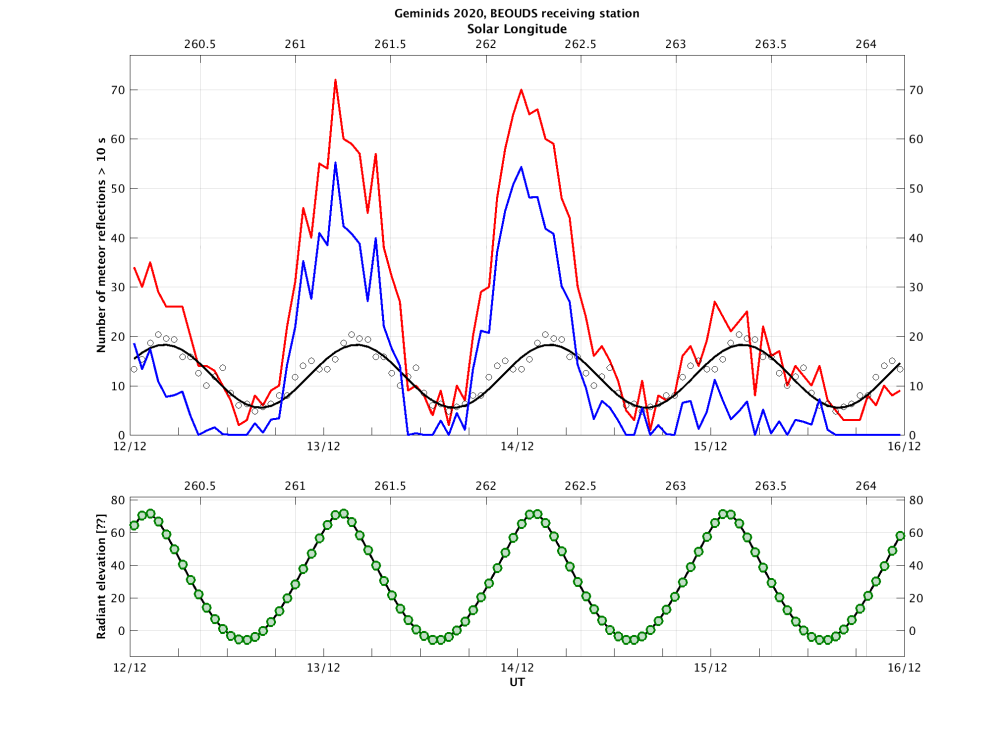
This has been confirmed by another BRAMS station, this time in Oudsbergen:
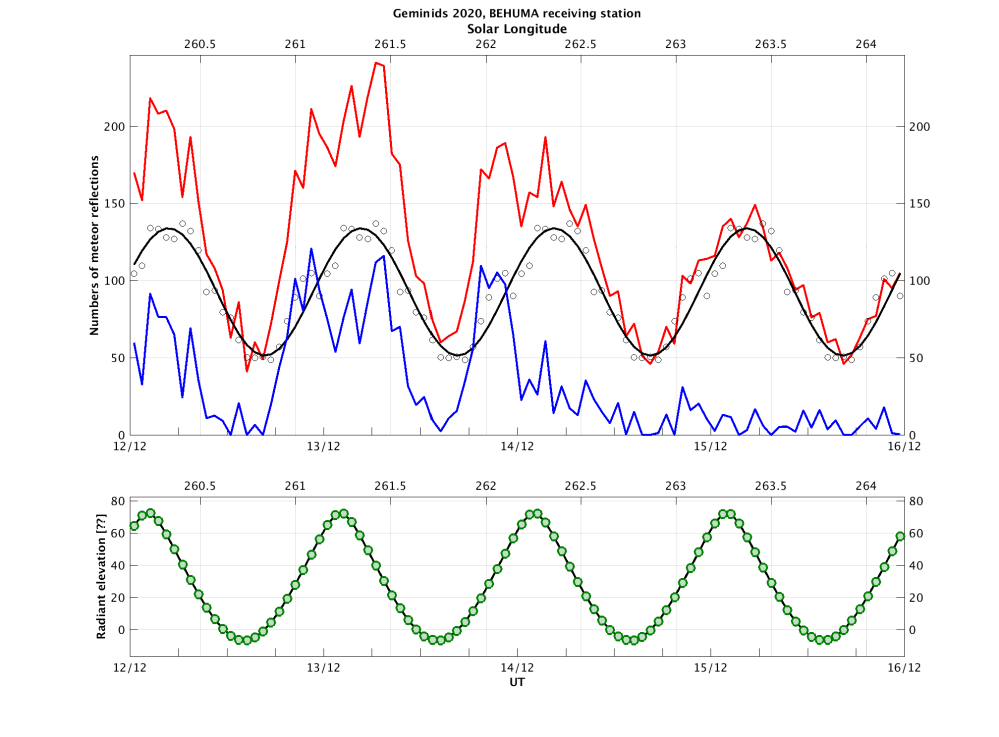
In between the two observed peaks, there is a steep decrease. From research, we know that near-peak Geminid rates persist for several hours. So the decrease that we observed in the BRAMS data might be (partly) attributed to the low radiation elevation. This should be further investigated.
Radio techniques are more sensitive to smaller (fainter) meteors compared to visual observations. Mass-sorting within the stream means fainter meteors should be most abundant a day ahead of the visual maximum. Also this has been clearly observed in the BRAMS data. Below you find the BRAMS activity curves for all meteors observed by the Humain resp. Oudsbergen receiving stations:
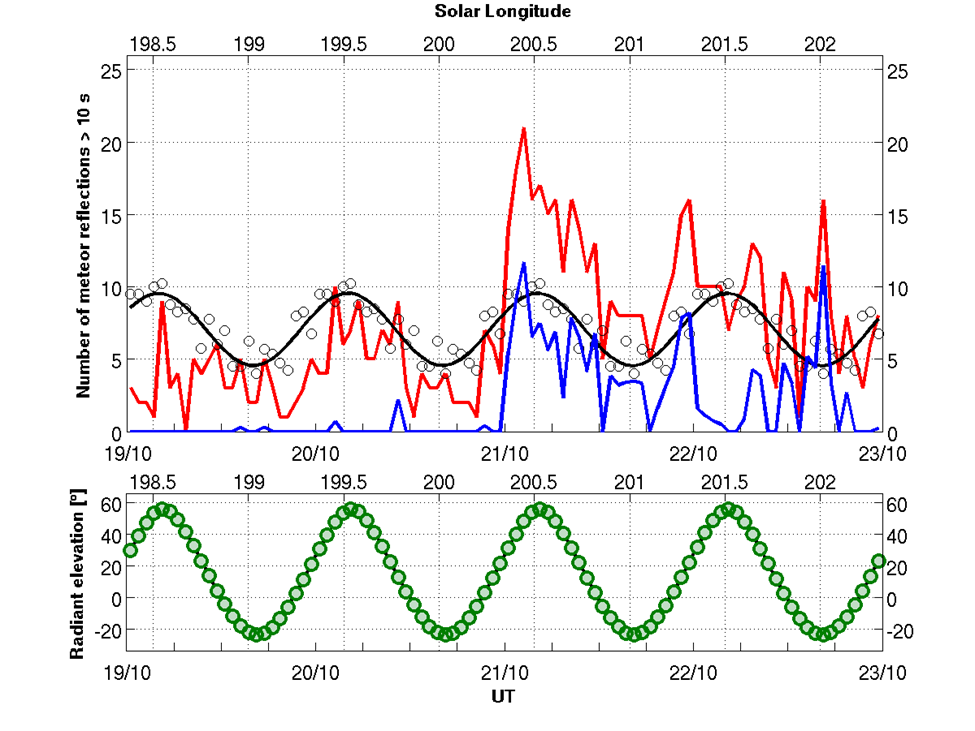
Preliminary results for the Orionids 2020
The Orionid meteor shower is associated with the famous Halley’s Comet. Halley's comet is also responsible for creating the Eta Aquariids, which occur each May. The radiant of the Orionids is located between the constellations Orion and Gemini (in the south-eastern sky before dawn, as viewed from mid-northern latitudes).
As usual, we uploaded observations of our receiving station in Humain. The peak activity was during the period of October 19-22. October 12, 13, 27 and 28 were used to estimate the sporadic activity.
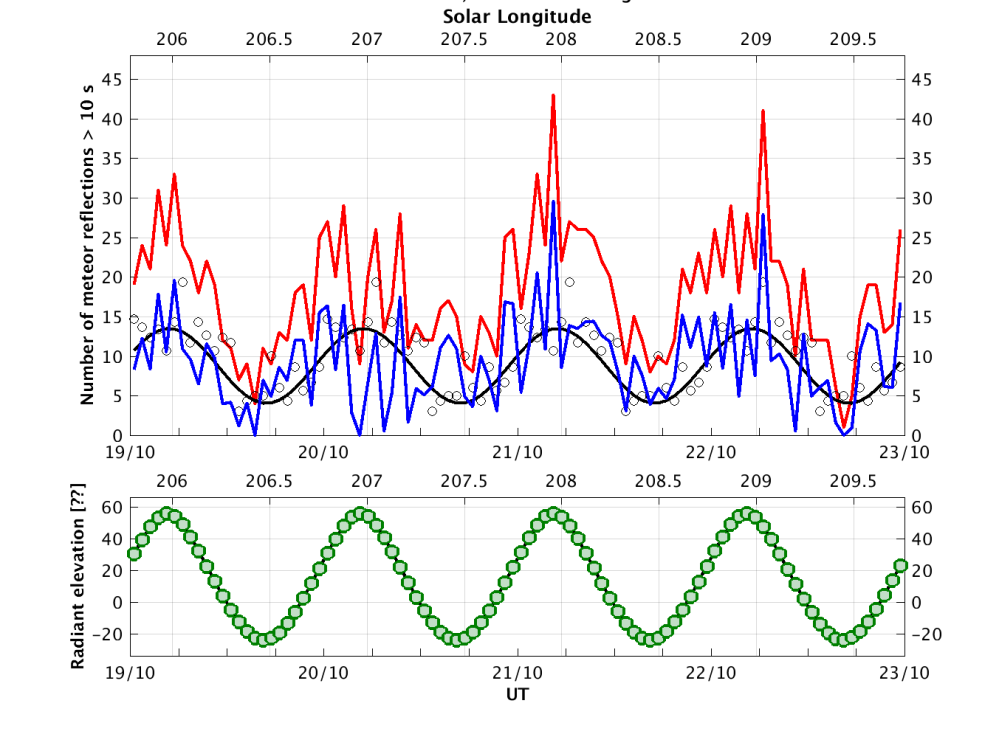
In the upper panel you can see the open dots which represent the background activity, and the black line is the best fit of a sine function on them. The red curve are the counts of meteors lasting for more than 10 seconds (i.e. overdense meteor echoes). Subtracting the background from the total meteor counts results in the blue curve, which represents the “clean” activity for the Orionids. The lower part of the figure shows the height of the radiant observed from the site in Humain.
The visual observations of the International Meteor Organization can be found here.
Results for the Arietids/zeta Perseids 2020
The Arietids and the Zeta Perseids are the most intense daylight meteor showers of the year. First discovered at Jodrell Bank Observatory in England during the summer of 1947, the showers are caused when the Earth passes through a dense portion of two interplanetary meteoroid streams. The Arietids and Zeta Perseids maxima tend to blend into one another. The parent bodies of these showers is still under debate.
The plot below shows the total number of long duration (>10s) radio meteor echoes registered from 4th to 11th June 2020:
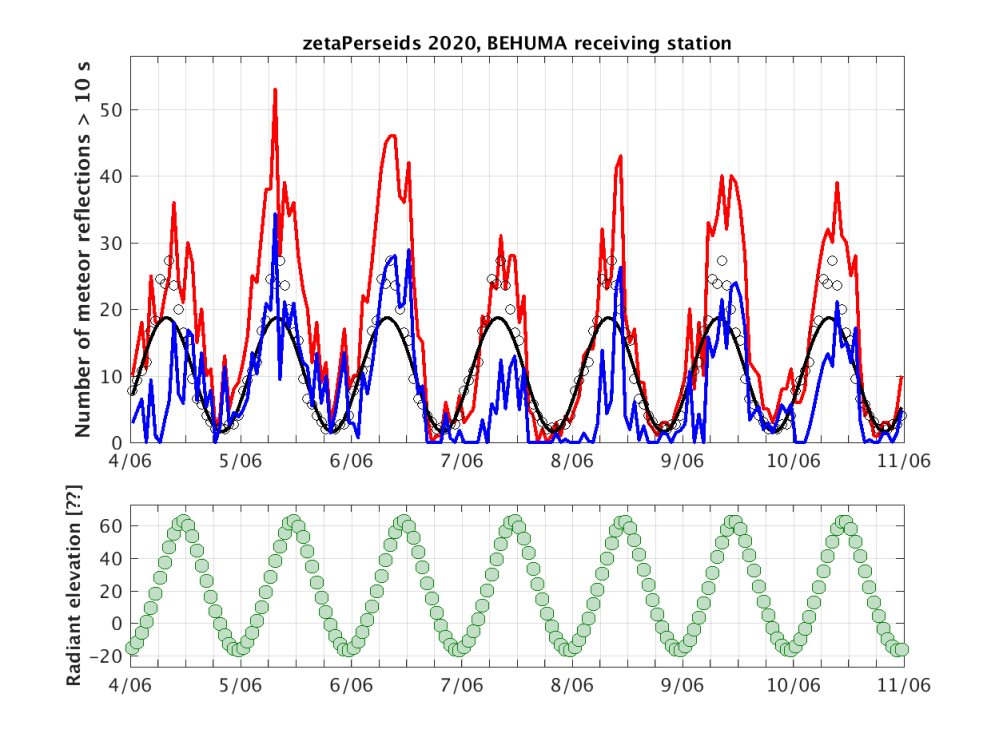
The peak of the Arietids was expected on June 7, while in our observations it came in June 5 around 12h UT (𝜆o = 75º). The peak of the Zeta Perseids was predicted for June 9, which is in accordance with our observations.
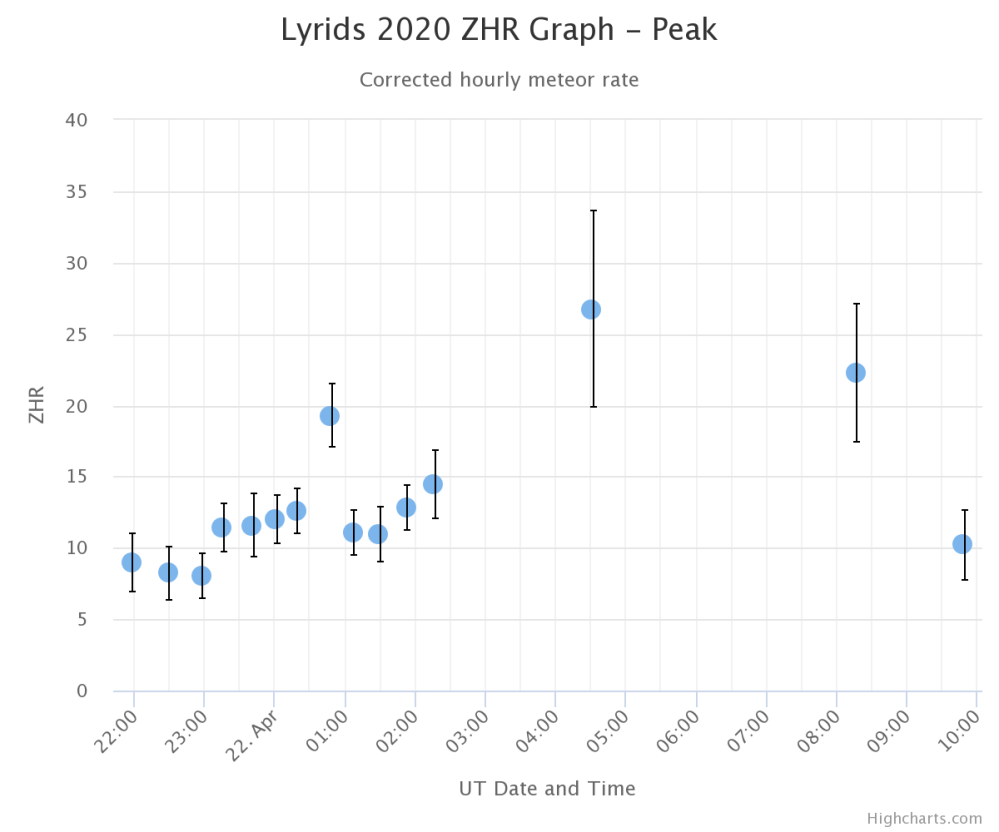
Results for the Lyrids 2020
The Lyrids are a meteor shower lasting from April 16 to April 26 each year. The radiant of the meteor shower is located in the constellation Lyra, near its brightest star, Vega. In ideal circumstances one can observe ~18 meteors per hour (ZHR). This year, the conditions for visual observations were excellent: the new moon was on April 23.
The source of the meteor shower are particles of dust shed by the long-period Comet C/1861 G1 Thatcher. The Lyrids have been observed and reported since 687 BC; no other modern shower has been recorded as far back in time.
The plot below shows the total number of long duration (>10s) radio meteor echoes registered from 21st to 24th April 2020:
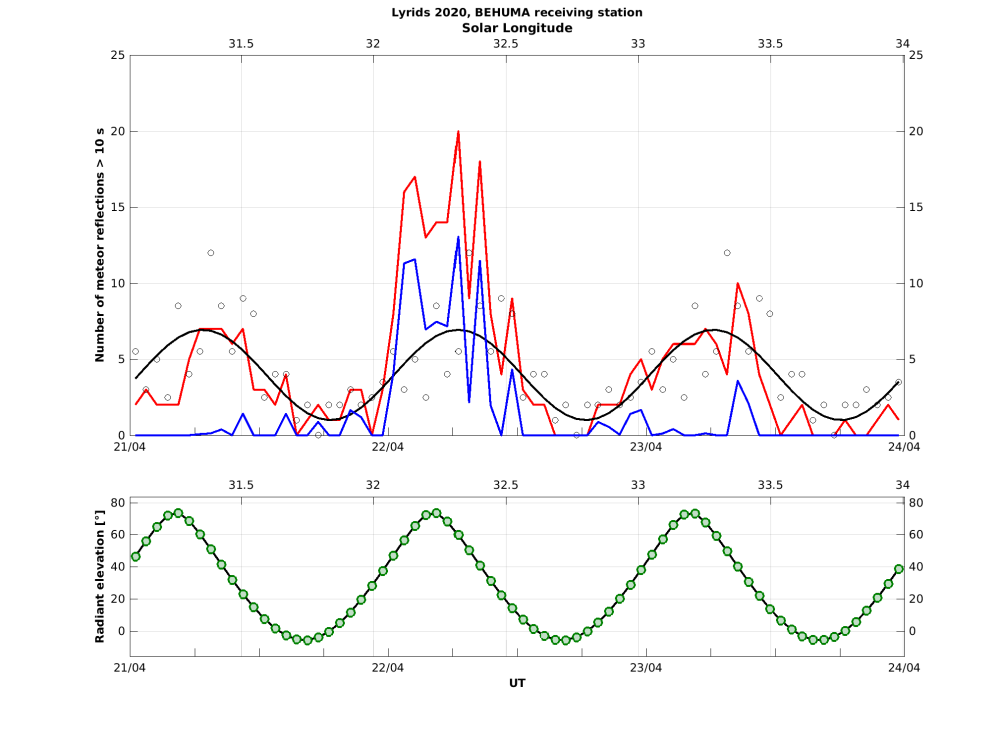
The blue curve, which corresponds to the observational data corrected for the background meteor activity, confirms the predicted maximum activity at solar longitude 𝜆o = 32.3º (22-Apr-2020 6h UT). It matches also fairly well with the visual observations published by the International Meteor Organization (IMO):
Results for the Quadrantids 2020
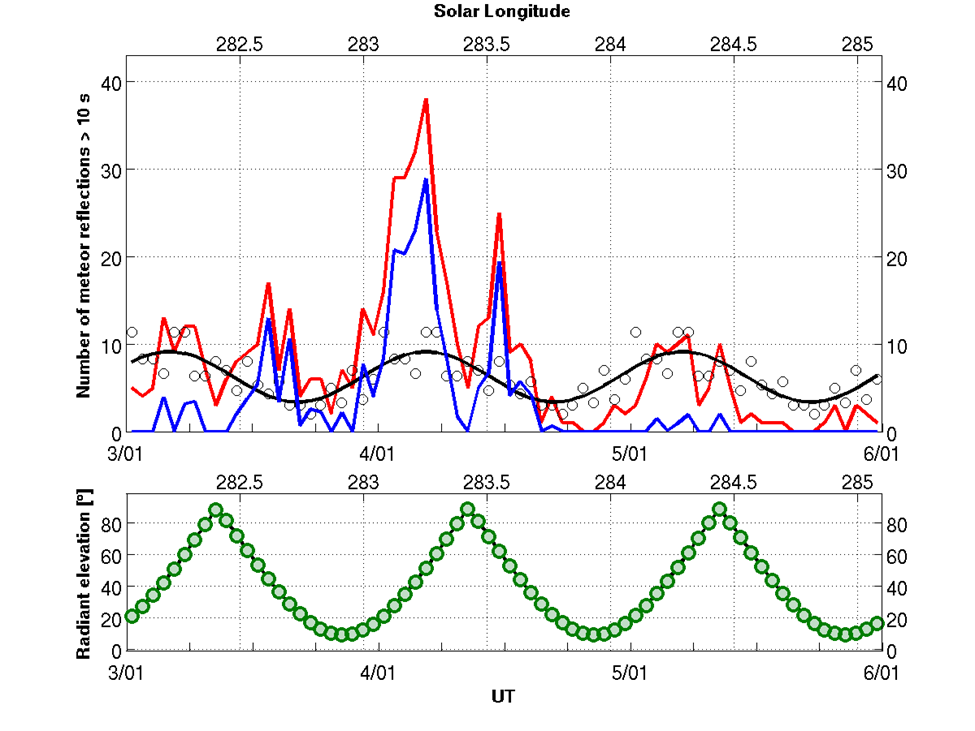
The Quadrantids meteor shower (010 QUA) was successfully recorded in January 2020 by our station in Humain. The meteoroid stream of the Quadrantids, linked to the comet 96P/Machholz 1 and the minor planet 196256 (2003 EH1), has proven to have quite complex structure which has produced different features from one year to another.
The plot below shows the total number of radio meteor echoes registered from 3th to 6th January 2020.
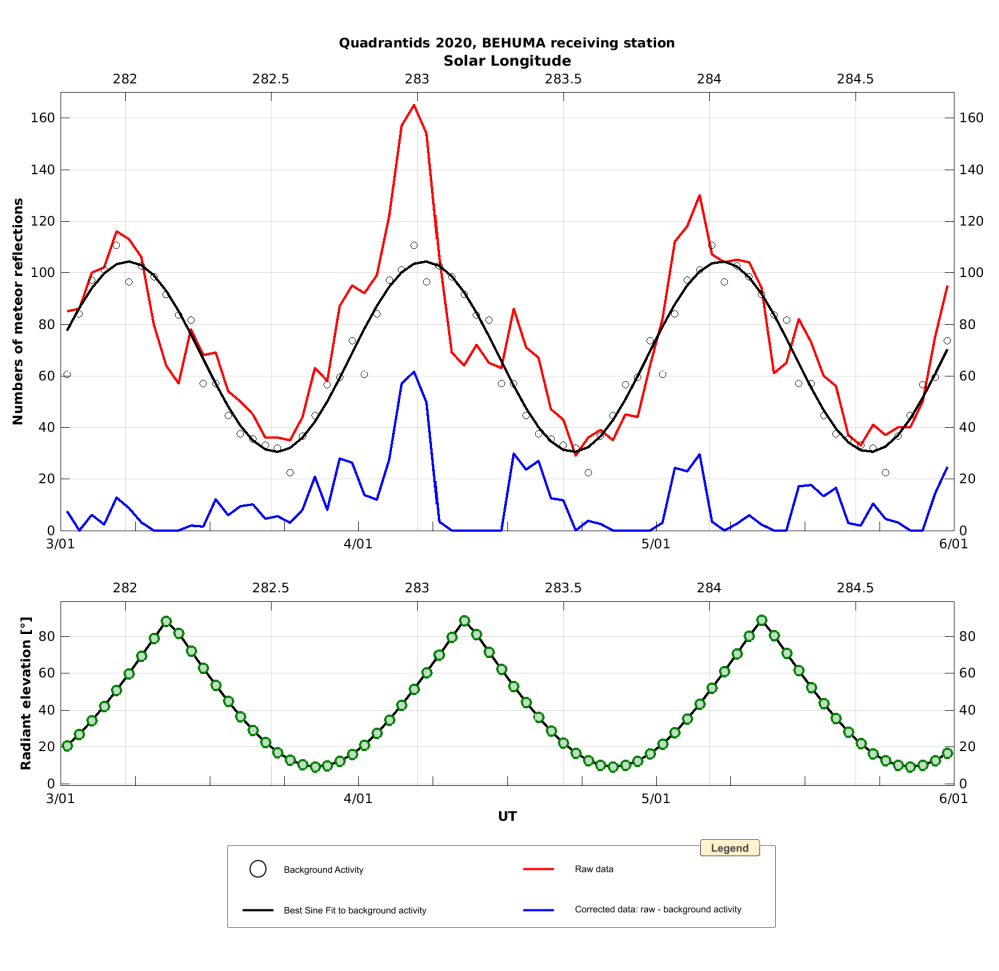
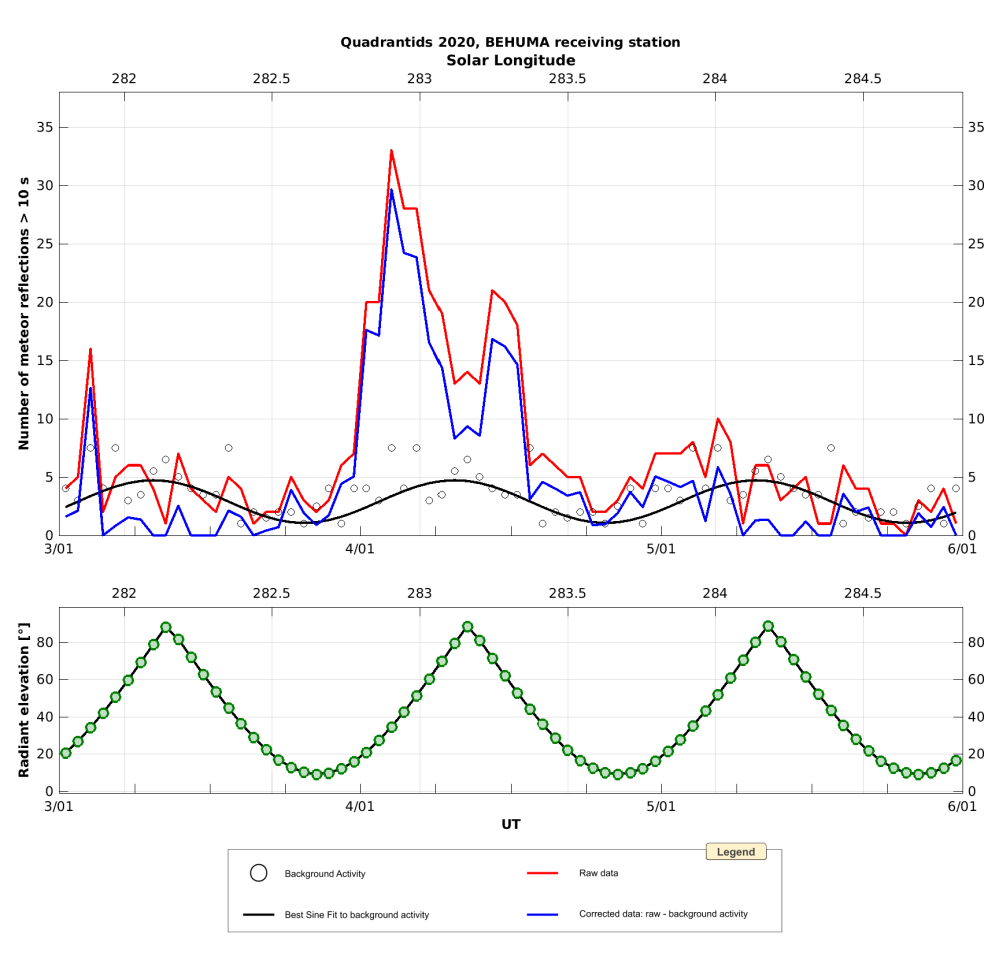
An increased meteor activity was detected on January 4, between 01h – 05h UT. The maximum activity registered by our station occurred around solar longitude 𝜆o = 282.99º (~4th Jan, 4h30m UT), pretty good agreement with the preliminary results from the Visual Meteor Data Base (VMDB) by the International Meteor Organization. However, if only those radio meteor echoes longer than 10 seconds are taken into account, the increase in activity level becomes much more evident, as shown in the graph below.
We have already accumulated five Quadrantids campaigns (2017–2020), which invites us to carry out a comparative study including data from all years. These results will be published here as soon as the analyses are finished.
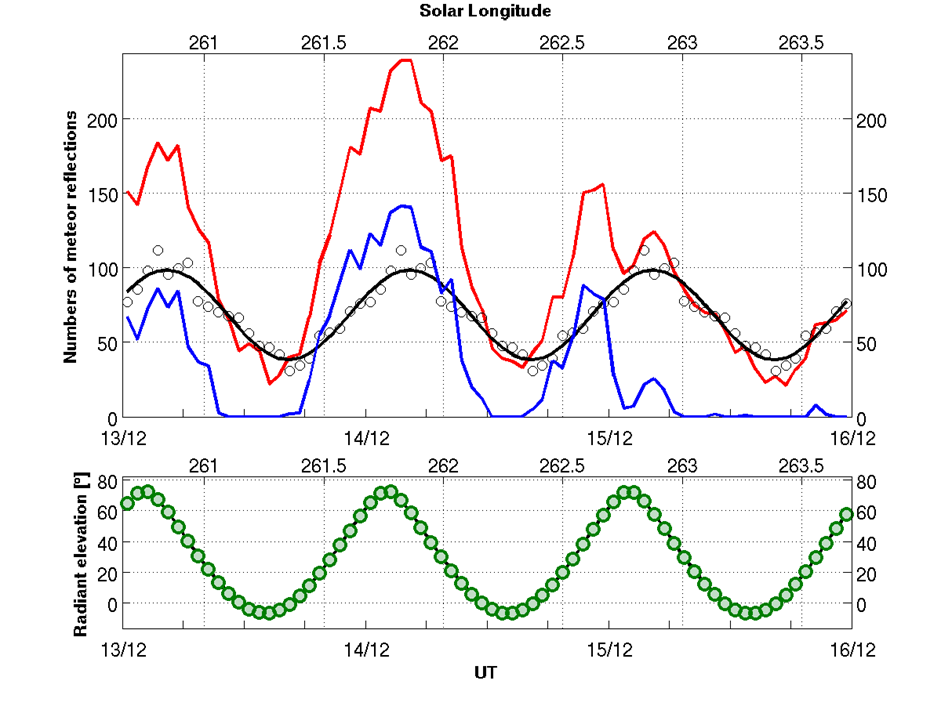
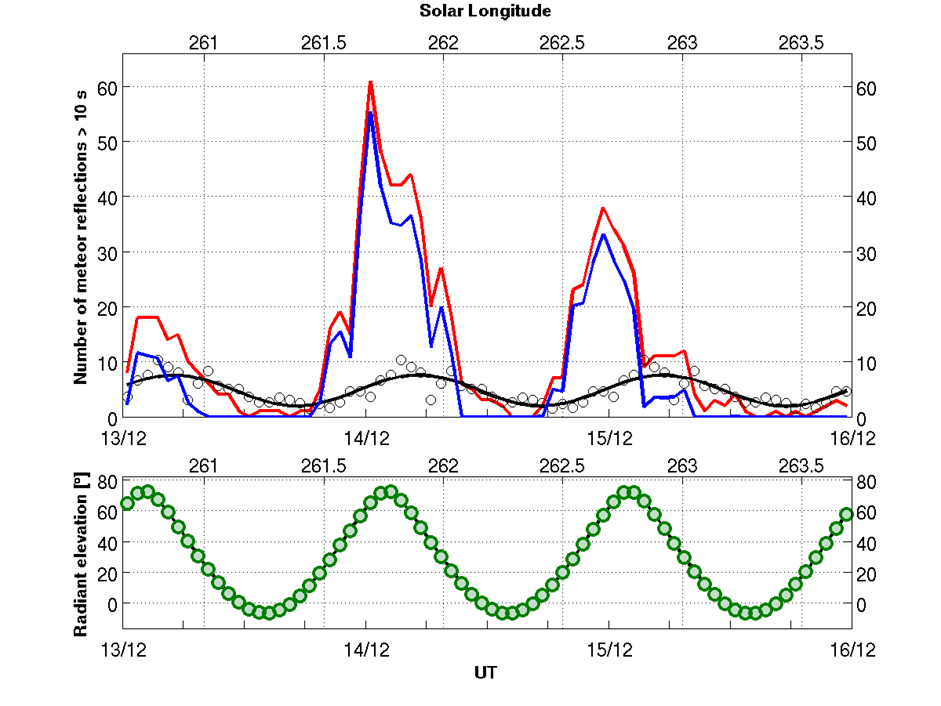
Results for the Geminids 2019
In 2019, the maximum of the Geminids meteor shower (004 GEM) happened just after the full Moon. This is usually a handicap for visual observers, but not for radio meteor observations! For this preliminary report, data from our station in Humain will be used. The plot below shows the number of reflections for those radio meteor echoes which lasted more than 10 seconds, a typical behaviour for overdense meteors.
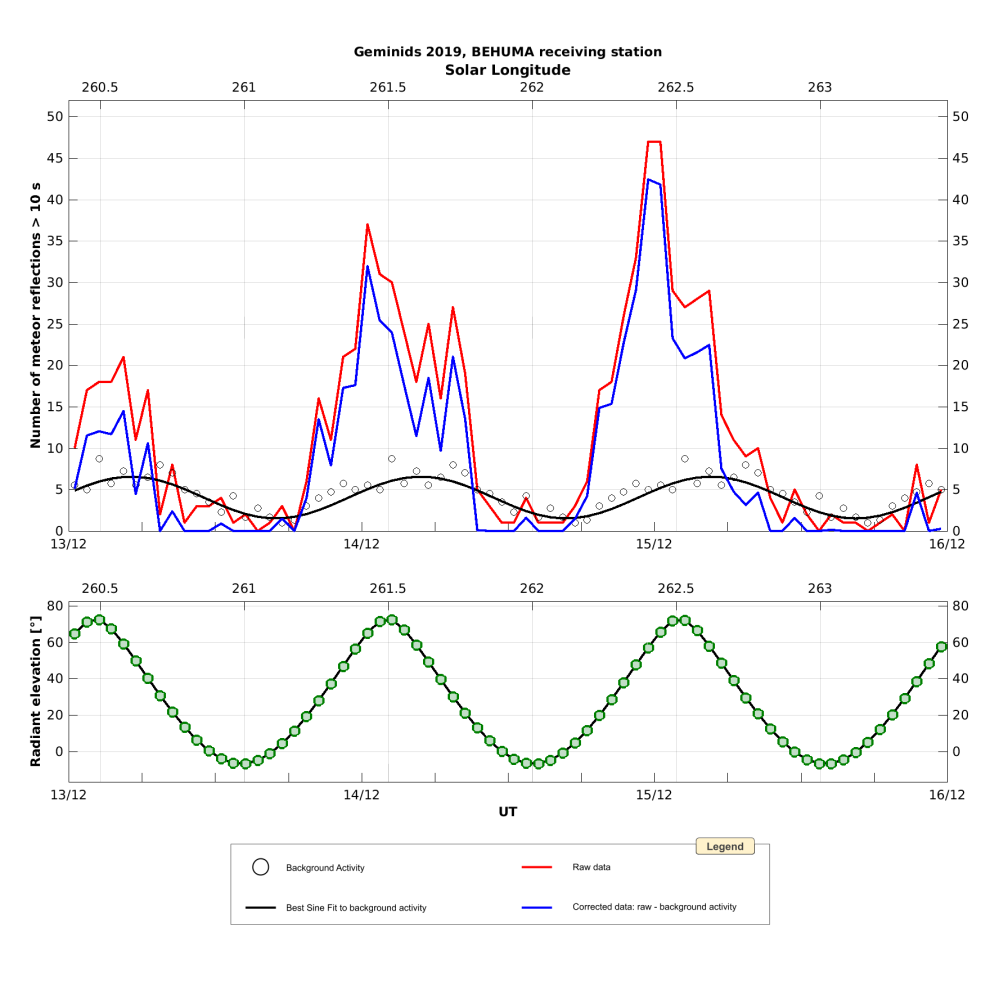
The blue curve, which corresponds to the observational data corrected for the background meteor activity, shows enhanced Geminids activity during 14 – 15 December. The artificial pit during the early afternoon hours of the 14th can be explained by the geometry of the reflections, in which the radiant elevation plays an important role.
The maximum activity registered by our station occurred at solar longitude 𝜆o = 262.4º (~14 Dec, 23h UT), matching fairly well with the visual observations published by the International Meteor Organization (IMO).
Results for the Draconids 2019
Although the Draconids (009 DRA) had produced a couple of storm-level displays in the last century (Rendtel, 2017), this meteor shower came back in 2019 without great expectations. The data from our station in Humain was used for this campaign. The maximum usually occurs around Oct 9, so we focus this effort on the period 7–10 Oct.
The figure below shows the duration of meteors lasting for more than 10 seconds, i.e. (mainly) overdense meteors registered during the period of activity of the Draconids in 2019.
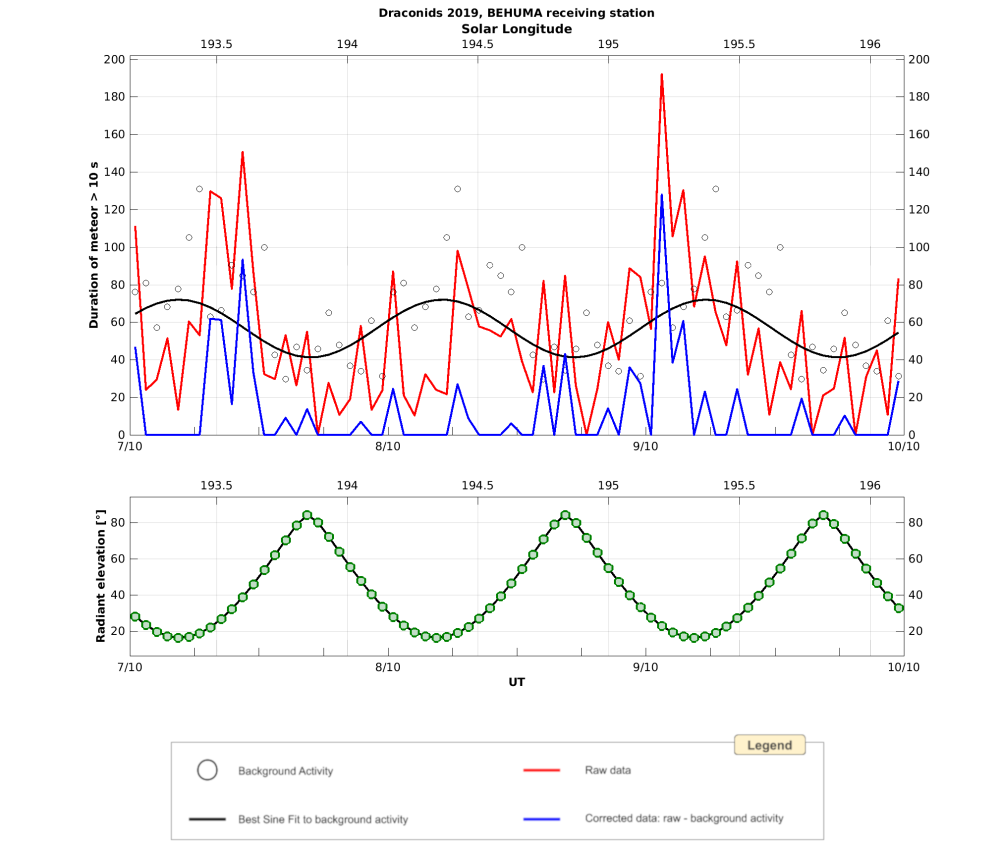
The corrected data (blue line) shows a sharp peak of activity around solar longitude 𝜆o = 195.2º, corresponding roughly to 9 October 2019, 2h UT – four hours before the maximum indicated on IMO’s Working List of Visual Meteor Showers.
Additionally, previous to the peak of activity mentioned above, an enhanced activity around 𝜆o = 193.6º (~ 7 October 2019, 10h UT) was also registered. Further investigation will be necessary in order to improve our understanding of this feature.
Results for the alpha Monocerotids 2019
The parent body at the origin of the Alpha Monocerotid (AMO) meteor shower is not known but is assumed to be a long-period comet. The shower was visually observed in 1925, 1935, 1985 and 1995, each time around November 21. Every time, the period of activity was very short (a few tens of minutes to a few hours). In 1995, it produced a spectacular outburst with around 200 meteors in half an hour. In 2019 a possible burst was expected in the early hours of November 22.
Visual observations results can be found on the IMO website at https://www.imo.net/observed-alpha-monocerotids-outburst/
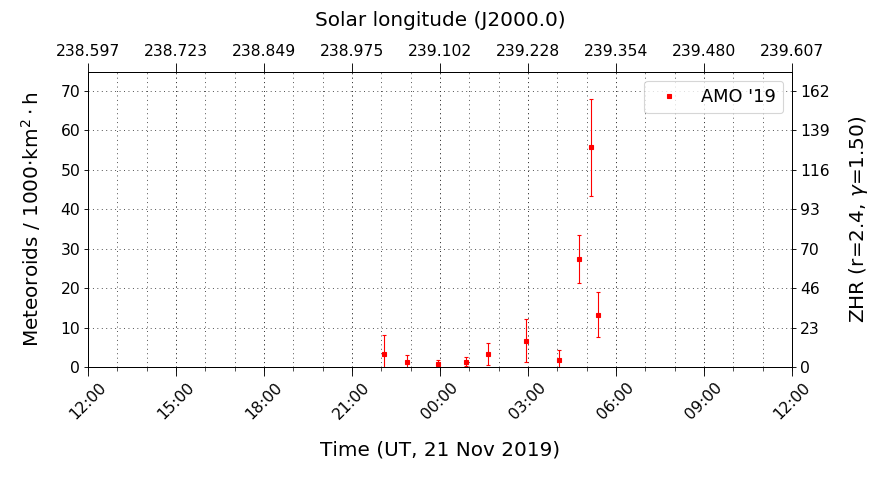
Results from video observations also showed that the predicted outburst was actually observed close to the predicted time, but rates were around 3-5 times below what was expected. Analysis of the data show the outburst occurred around 04h57 UT, with ZHR (Zenithal Hourly Rate) ranging close to 80-100, which shows time predictions were accurate, but trail position must have been slightly off the expected position.
Below is a graph obtained using the program Meteor Flux 2.1 (at meteorflux.org) to generate video observations for the AMO :
The results from the RMZ using radio observations from the BRAMS network are shown below. As usual in these activity plots, the red line shows the hourly total number of meteors counted by the RMZ users, the dots represent the hourly counts of the background activity (estimated and averaged from data collected on 21 and 23 of November), the black line represent the sine curve best fitting the individual dots, and the blue line is an estimate of the Alpha Monocerotid activity (obtained by subtracting the black line from the red one). The first graph shows the total activity including all meteor echoes while the second graph shows only the meteor echoes lasting more than 10 seconds.
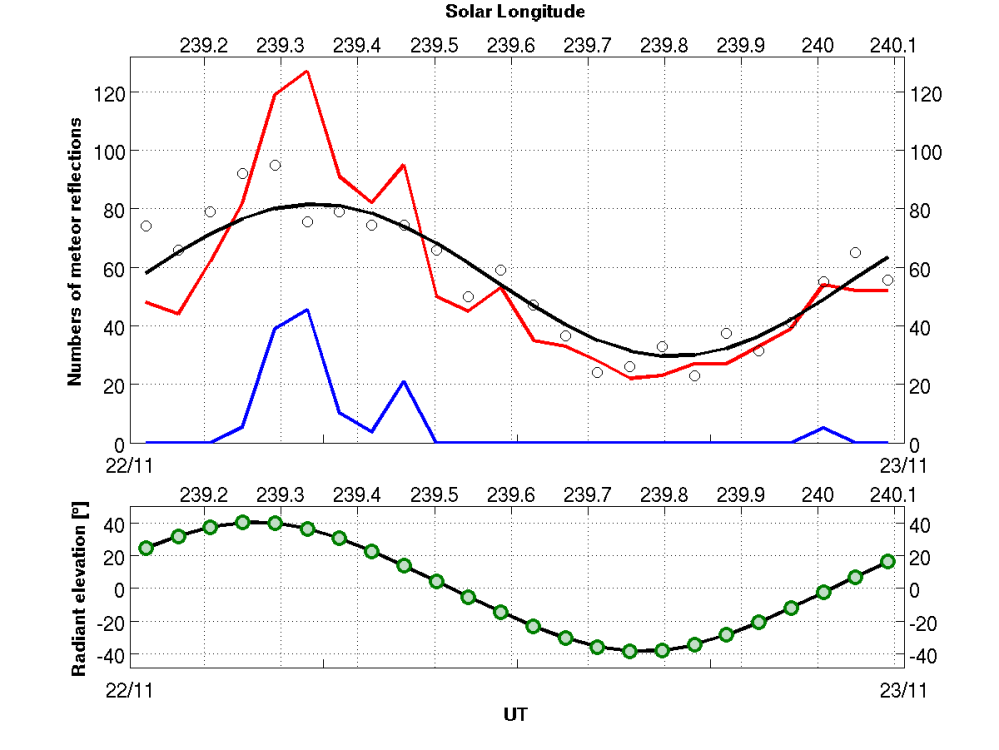
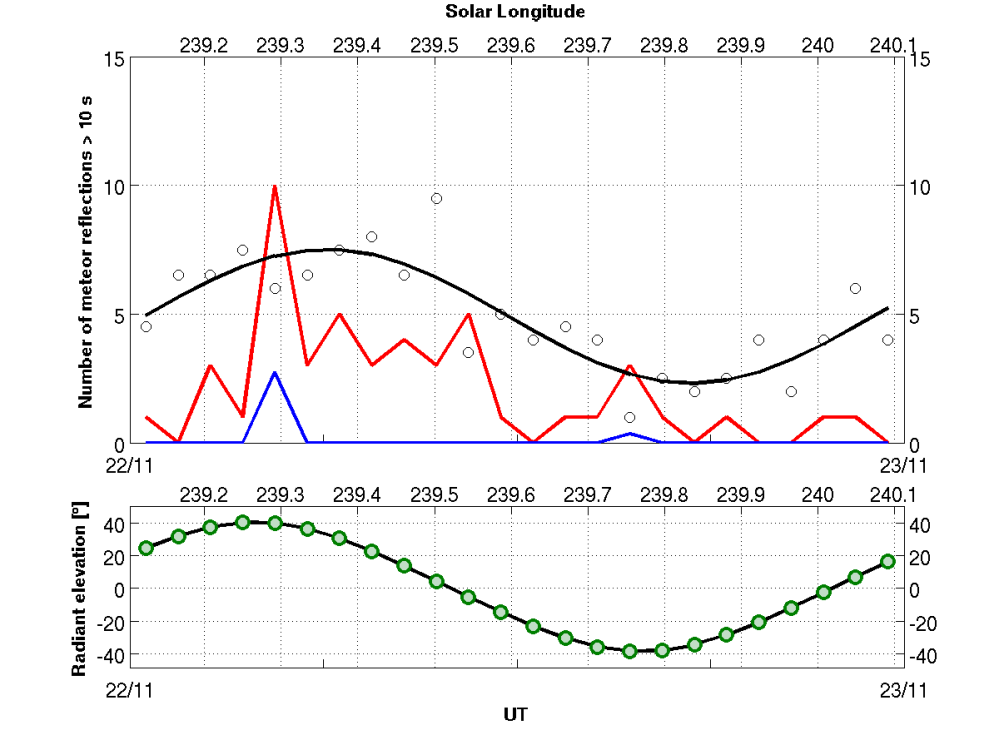
The peak found in video observations is clearly detected as well in the BRAMS data around 05H00 UT (solar longitude 239.3°). A second peak is visible at around 08H30 UT (solar longitude 239.45°) in the first graph and needs to be investigated to see if it is real. It was not detected visually and does not appear in the second graph with only those meteor echoes lasting more than 10 seconds. So a careful inspection is needed. We will update this text soon with discussions about this second peak.
Results for the Perseids 2019
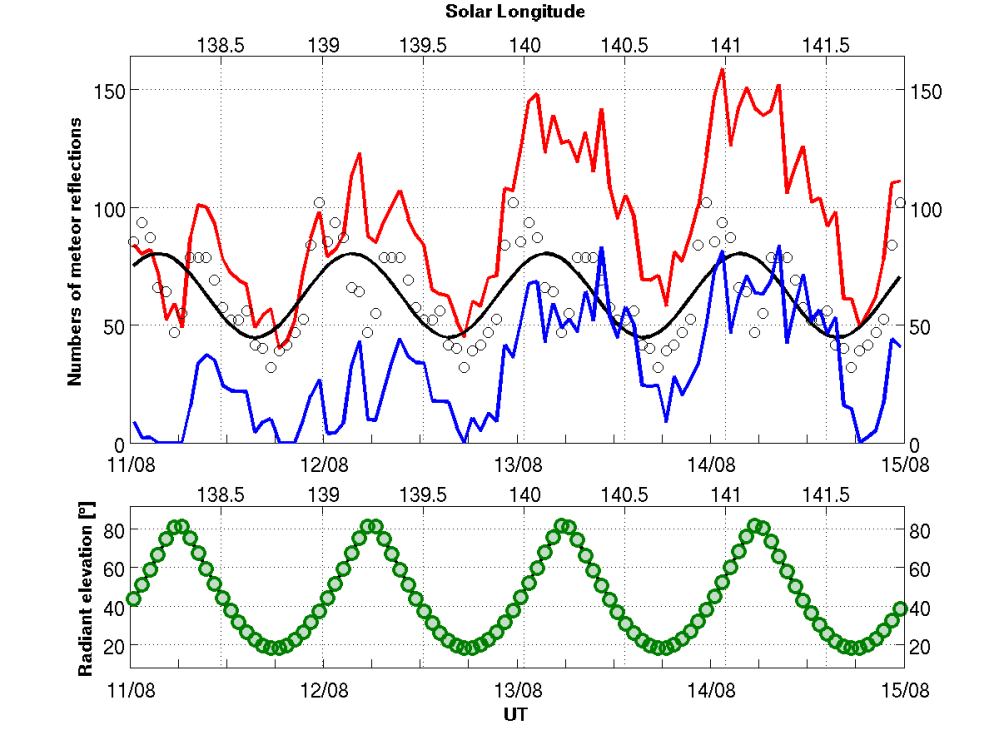
The Perseids (007 PER) meteor shower –one of the most popular among the meteor visual observers community due to its usually high activity rates– has its maximum activity between 139.8 and 140.3 degrees of Solar Longitude (𝜆o), corresponding in 2019 to August 13th 02h to 15h UT. Additionally, there was a forecast of an encounter with a filament on August 13th at 02h UT with a possible high activity display.
The figure below shows the total duration of the meteor echoes registered in the station of Humain from August 11th to 15th 2019.
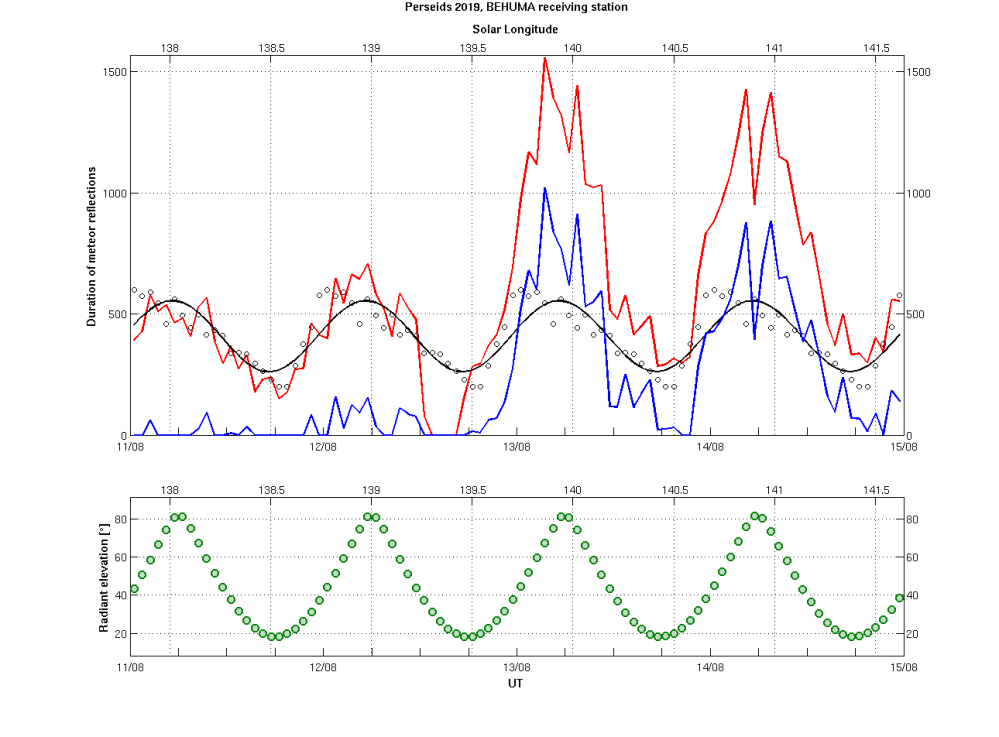
The observations registered in 2019 shows enhanced activity between August 13th and 15th, with two double-peak structures –probably due to factors that should be corrected by the observability function–, one occurring during August 13th and another on 14th. The very first maximum was registered around 𝜆o = 139.85º, slightly behind the time of the Peter Jenniskens forecasted filament encounter.
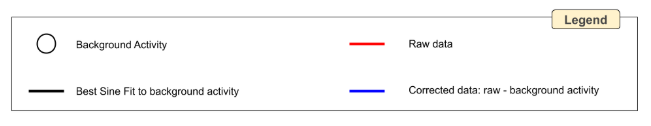
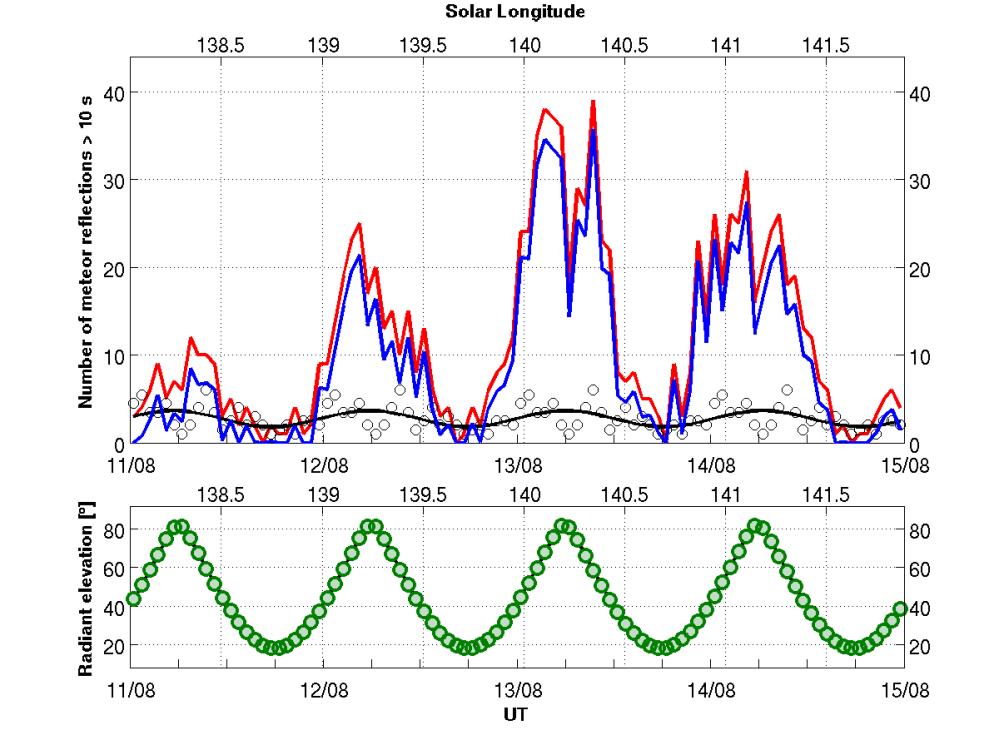
A secondary double-peak can be also recognized around 𝜆o = 140.8º and 141º, somewhat outside of the maximum activity expected period, as shown in the plot below.
The plot includes the number of meteor echoes whose total duration was larger than 10 s, usually associated to visually bright meteors, more frequent during major meteor showers. As can be seen in the graph, this late secondary double-peak reaches a similar level of activity regarding the previous one. However, it is interesting to highlight the fact that valley of low activity between the two double-peak structures coincide with low altitude of the radiant over the horizon which can lead to speculate the possibility of having only one broad period of high activity, starting with the very first peak (𝜆o = 139.85º) and lasting –at least– until 𝜆o = 141.0º, if a proper correction of the radiant’s elevations would be taken into account. Further analysis are required in order to clarify this feature on 2019 Perseids activity.
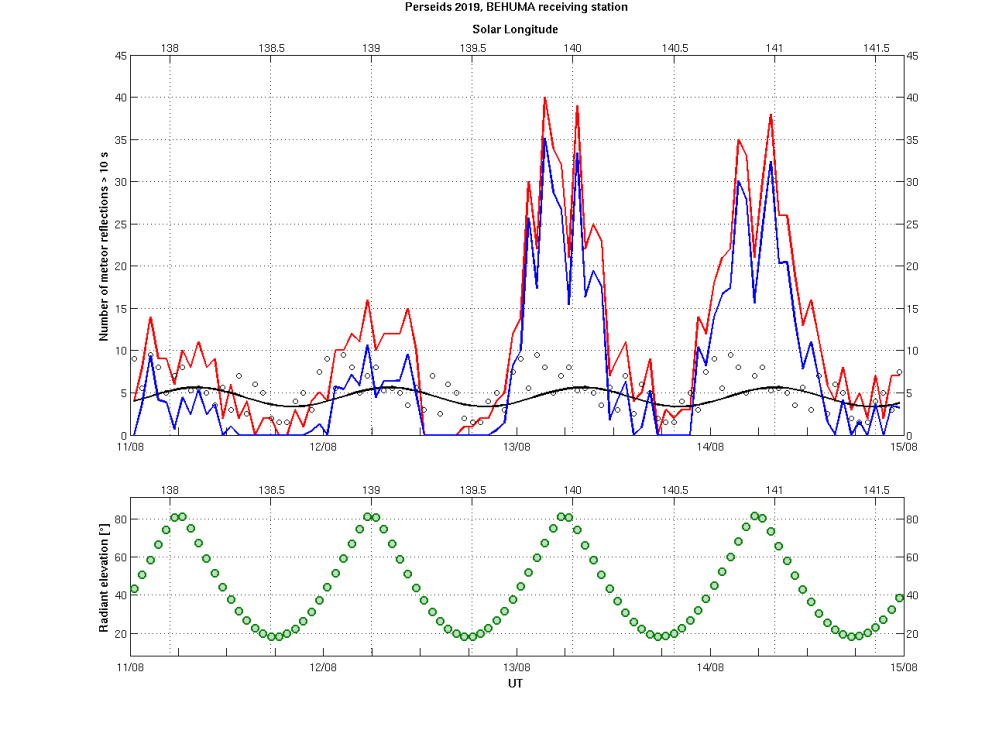
Results for the Quadrantids 2019
The Quadrantids (010 QUA) meteor shower came in 2019 with expectations among the meteor-science community due to the optimum observing conditions for the maximum on January 4. Its radiant is circumpolar in many northern hemisphere sites and the expected peak time, 2h UT, is based on the best-observed return of the shower (IMO). Extra complexity is added by the fact of a mass-sorting of particles across the meteoroid stream related to the comet 96P/Machholz and the minor planet 2003 EH1. Additionally, mass segregation effects have also been found for a small peak before the main one, and another one has been registered occurring some hours after the visual maximum on few returns.
The figure below shows the total activity registered in the station of Humain from January 3 to 6 (for the meaning of each curve on the plot, please see previous shower results).
An increased meteor activity was detected on January 4, between 0h – 6h UT, including a raw count of more than twice the background activity around 4h UT.
A clearer view of the peak(s) of activity arise when considering only those long-lasting radio meteor echoes (overdense meteors). The next figure shows the total amount of meteor echoes lasting more than 10 seconds during the same period.
Although the total numbers of meteor echoes for the maximum peak of activity are much less than the values shown in the previous graph, the activity during the maximum stands out more clearly. Here we have the main peak again (~4h UT), but now a second peak around 11h30m UT is evidenced in the graph.
Moreover, there is also a period of relatively high activity between 12h30m and 16h15m on January 3, which becomes apparent especially taking into account the low altitude of the radiant during that time.
Results for the Geminids 2018
Again, the data from our station in Humain were analyzed.
The Geminids 2018 meteor shower reaches its maximum on December 14 at 12h30 UT.
The figure below presents the activity profiles between December 13 and December 16
(for the meaning of each curve on the plot, please see previous shower results).
This second plot only shows meteors that last more than 10 seconds for the same period:
From this Figure, we derive that the Geminid maximum took place on December 14.
Results for the Orionids 2018 meteor shower
The Orionid meteor shower is associated with the famous Halley’s Comet, which is also responsible for creating the Eta Aquariid, another meteor shower that occurs each May.
The radiant of the Orionids is located between the constellations Orion and Gemini (in the south-eastern sky before dawn, as viewed from mid-northern latitudes). However due to an unfavorable moon phase, visual observations of this meteor shower were rare this year. Because of the lack of visual observations, we decided to process the observations of the BRAMS network.
As usual, we uploaded observations of our receiving station in Humain. The peak activity was during the period of October 19-22. October 12, 13, 27 and 28 were used to estimate the sporadic activity.
In the upper panel you can see the open dots which represents the background activity, and the black line is the best fit of a sine function on them. The red curve are the counts of meteors lasting for more than 10 seconds (i.e. overdense meteor echoes). Subtracting the background from the total meteor counts results in the blue curve, which represents the “clean” activity for the Orionids. The lower part of the figure shows the height of the radiant observed from the site in Humain.
It is unexpected to see activity of the Orionids in the afternoon of October 21 and 22, because the radiant was ~20° below the horizon during this period. We are still investigating this anomaly.
The (few) visual observations of the International Meteor Organization can be found here.
Results for the Draconids 2018 meteor shower
The data from our station in Humain was used for this campaign. The background meteor activity was estimated from data obtained on October 1st, 2nd, and 12th, days out of Draconids’ activity and when no other meteor shower maxima occurred.
The Draconids had produced a couple of storm-level displays in the last century. Most detected showers occurred in years close to when 21P/Giacobini-Zinner comet, the parent body of the Draconids, returned to perihelion. Last year, on September 10th 2018, the comet returned and so an increased activity was expected.
The plot below shows the activity of the Draconids from 7th until 10th October. The maximum, which was expected to happen on the night of October 8-9, is indeed present on it.
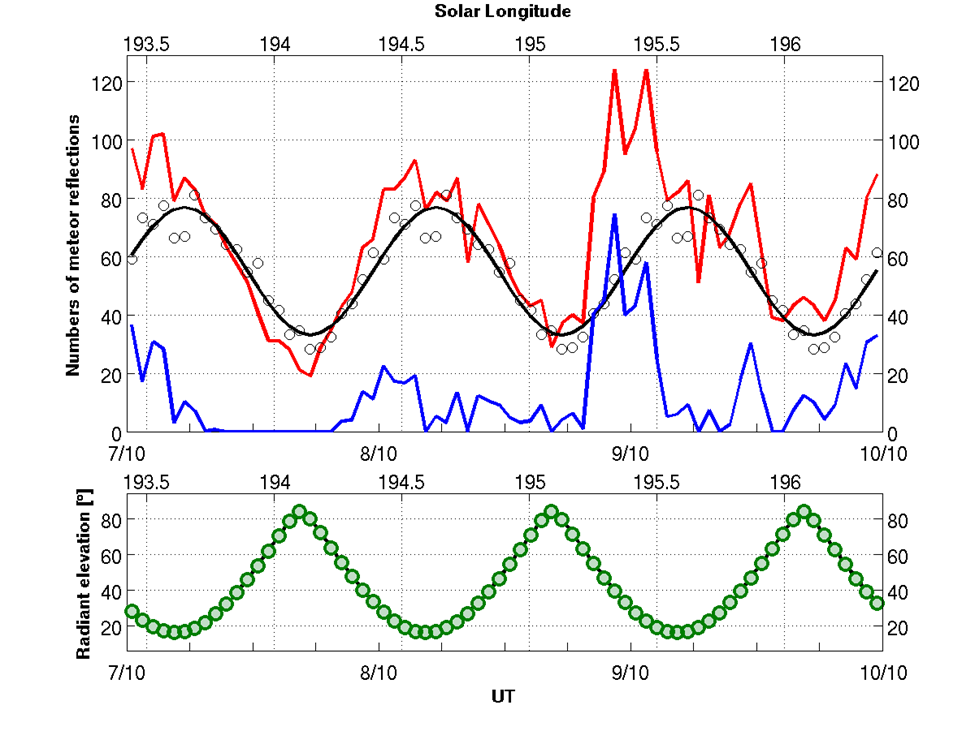
In the upper panel you can see the open dots which represents the background activity, and the black line is the best fit of a sine function on them. The red curve is the total meteor counts during the period in scope. Subtracting the background from the total meteor counts results in the blue curve, which represents the “clean” activity for the Draconids, specifically. The lower part of the figure shows the height of the Draconids’ radiant observed from the site in Humain.
If we consider only those meteors lasting for more than 10 seconds (i.e. overdense meteor echoes), the peak of activity is even more clear:
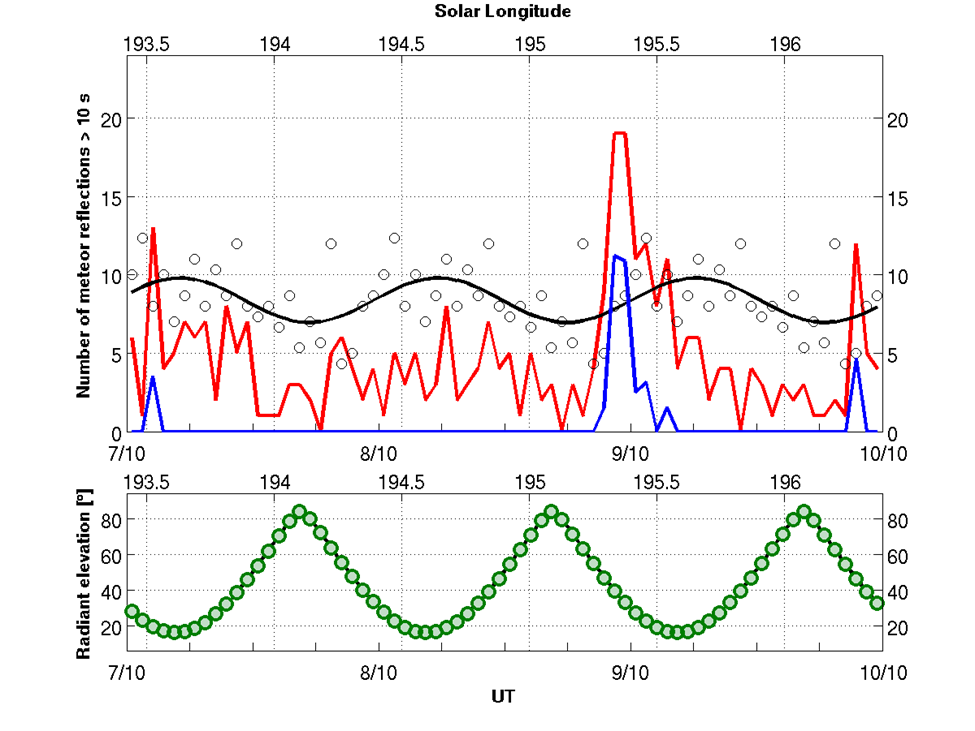
Although the maximum did not reach a particularly high value -so no storm this year-, the typical short-lived peak of activity of this shower is quite noticeable between 22h – 23h October 2018 (Universal Time, UT).
Extra corrections to this data are needed (i.e., applying the observability function) in order to get a standardized curve of activity. However, our preliminary results show very good agreement with those obtained the visual observations by IMO.
Results for the Perseids 2018
As usual now, the data from our station in Humain were used. The background is currently estimated from data obtained on 21 and 22 of July, when the Perseids were not active yet and no other known meteor shower occurred. The background will later be updated with data from 21 of August in order to make an average between data before and after the Perseids 2018.
The results below show the activity of the Perseids from 11 until 14 of August. The maximum was expected during the night of 12 to 13 August and this was indeed observed. Usually, after the maximum, the number of observed Perseids very quickly drop to zero. This year a significant amount of Perseids were still observed on August 13 and even 14.
The first curve below contains the following information :
- the black empty circles are the hourly averages for the background (currently obtained on 21 and 22 of July)
- the black curve is a sinusoidal curve best fitting the black empty circles. We do that because the background can be highly variable from day to day and sometimes hour to hour.
- the red curve is the hourly raw counts of meteor echoes during the Perseids. It is the sum of real Perseids + meteors belonging to the background
- the blue curve is the result of the subtraction of the black curve from the red curve. It is assumed to be a reasonably good estimate of the Perseid meteor shower activity.
- the green points show the elevation of the radiant of the Perseid hour by hour. As a reminder, when the radiant is too low on the horizon, we cannot detect meteor echoes from this meteor shower as they are below or near the horizon. When the radiant is very high in the sky, this is also not very favorable for radio observations because of the specular aspect of the reflection of meteor echoes.
The results are shown for 4 days, from 11 to 14 August, as can be seen on bottom horizontal axes. On top horizontal axes, we also show the solar longitudes which gives the position of the Earth on its orbit and, is a more appropriate information on a meteor shower’s maximum than the date, e.g. to compare results obtained on different regions of the Earth.
Again, the activity of the Perseids can be seen in the blue curve but it is not striking. It appears more clearly when we consider only those meteor echoes lasting more than 10 seconds (overdense meteor echoes) as these ones occur way more often during the Perseids than during the sporadic background time. A similar plot is shown below for these long meteor echoes :
The activity peak was broad and indeed observed on the night from 12 to 13 August. Note that the sharp decrease around 6 AM on August 13 during this broad maximum is most certainly due to the radiant of the Perseids being very high. Correction for this will be taken soon by the so-called Observability Function. The plot also indicates that there were still a lot of activity on August 14 as was confirmed by visual observations.
Activity plots of the Geminids 2017 and Quadrantids 2018
For these two meteor showers, data from our station in Humain have again been analyzed. The results for the Geminids 2017 are shown below.
The red curve is the raw counts per hour obtained from the aggregation of individual rectangles drawn by RMZ users. Two days on December 13 and 14 are shown, corresponding to the period of activity of the Geminids. The dots are the hourly raw counts for the background activity, averaged from analysis of observations obtained on 2, 3 and 18 of December, when the Geminids (and any other meteor shower) were not active. The sine curve is a best fit to these dots. When we subtract this sine curve from the red curve, we obtain the blue curve which is then an hourly estimate of the Geminids 2017 activity. Below the green points show the radiant elevation above the horizon. When the radiant is too high or too low, these are conditions that are not favorable to radio observations. You can indeed see that the blue curve is very close to zero when the radiant is near 0° or below the horizon but you can also see a dip in the blue curve around 02H00 UT.
The curves are shown as a function of time (in Universal Time UT) but also as a function of solar longitude (on top x-axis of each graph). Solar longitude is the angular distance along the Earth’s orbit measured from the intersection of the ecliptic and the celestial equator where the Sun moves from south to north. It gives the position of the Earth on its orbit and, hence, is a more appropriate information on a meteor shower’s maximum than the date.
The peak of activity was observed in the early hours of 14 December (or around solar longitude 262°). This was also observed by visual observers. The peak of activity on December 13 near solar longitude 261° is strange and needs some extra-investigation to confirm its validity.
In the figure below we also present the results for the Quadrantids 2018 for the station in Humain in a similar way. Activity curve is shown between January 3 and 5, 2018. Background days are estimated from observations on 31 December and 6th of January.
More information will be added in the coming days.
Activity plot of the Perseids 2017
We want to compute the activity of the Perseids 2017 for the BRAMS station in Humain (called BEHUMA) from 11 to 13 August, i.e. plot a graph showing the number of detected meteors per hour. These numbers are the sum of two populations of meteors, namely those from the meteor shower itself and those due to the sporadic meteors. The latter activity is called the background hereafter. The most accurate way to separate these two populations is by looking at individual trajectories and consider only the meteors coming from the radiant direction (+/- a few degrees) as belonging to the meteor shower. In that way the contamination by the background is very weak. We work on this but retrieving trajectories from BRAMS data is not yet possible. Instead, we have to estimate the activity of the background in a different way. For that we select a few days before the meteor shower where only meteors from the background are observed and we compute an average activity curve for these days that we can subtract from the general activity curve.
For the BEHUMA station, we selected 22 and 23 of July. Indeed, the Perseids is a meteor shower that is active during a few weeks. Even though the maximum of activity is around 12-13 of August every year, Perseids can be detected as early as 25 July. Of course, there is a limitation with this approach since the background itself can vary a bit between 3rd week of July and 2nd week of August. The only way to minimize this effect is by adding more background days measured right after the meteor shower. We plan to do that soon by considering data from 19 and 20 of August. 18th August was avoided because this is the maximum of activity of another weak meteor shower called the Kappa-Cygnids.
Results obtained from the RMZ results for 22 and 23 of July at BEHUMA are presented in Figure 1 below :
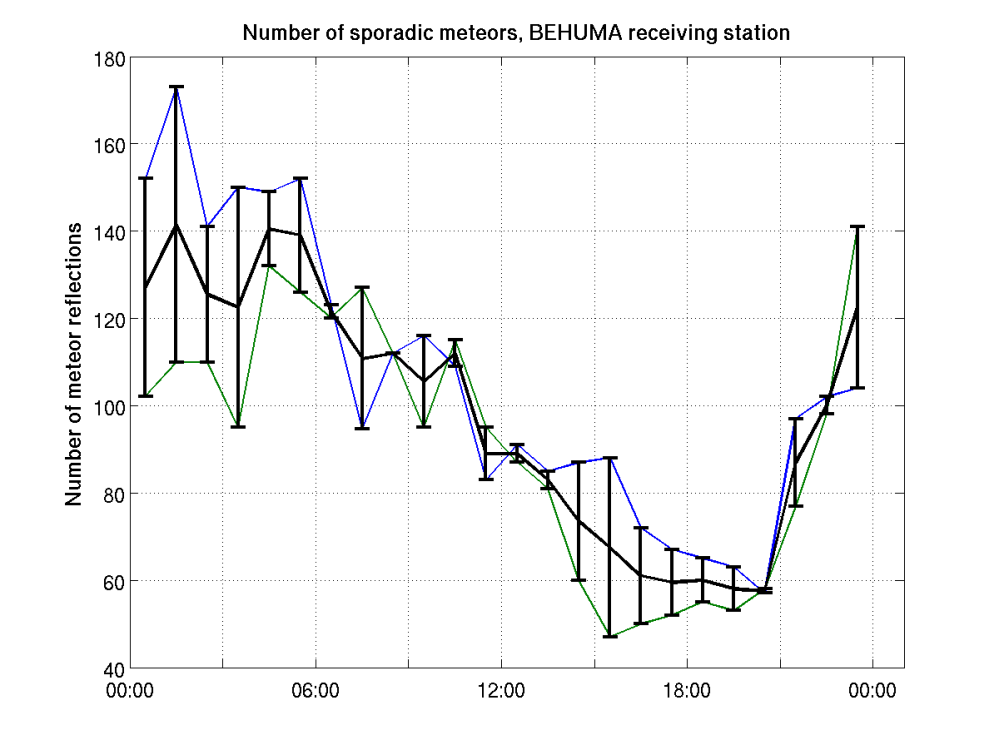
Figure 1 : number of sporadic meteors counted for the station BEHUMA on July 22 and 23 and the average of the two curves
The blue/green curve shows the activity of 22/23 July. Horizontal axis is the time in UT (Universal Time = CET-2h in summer). The activity profile of the background shows the traditional maximum early in the morning and a minimum late in the afternoon, simply due to the rotation of Earth and its displacement along its orbit. Some scatter from day to day is clearly visible. The black curve is the average of the two curves hour per hour. The error bars are also plotted and are the standard deviation of the values. Since we have only measurements for 2 days, the error bar is simply half of the difference between the two values. If we add more days in the future, the average will become better in statistical terms and will have reduced error bars.
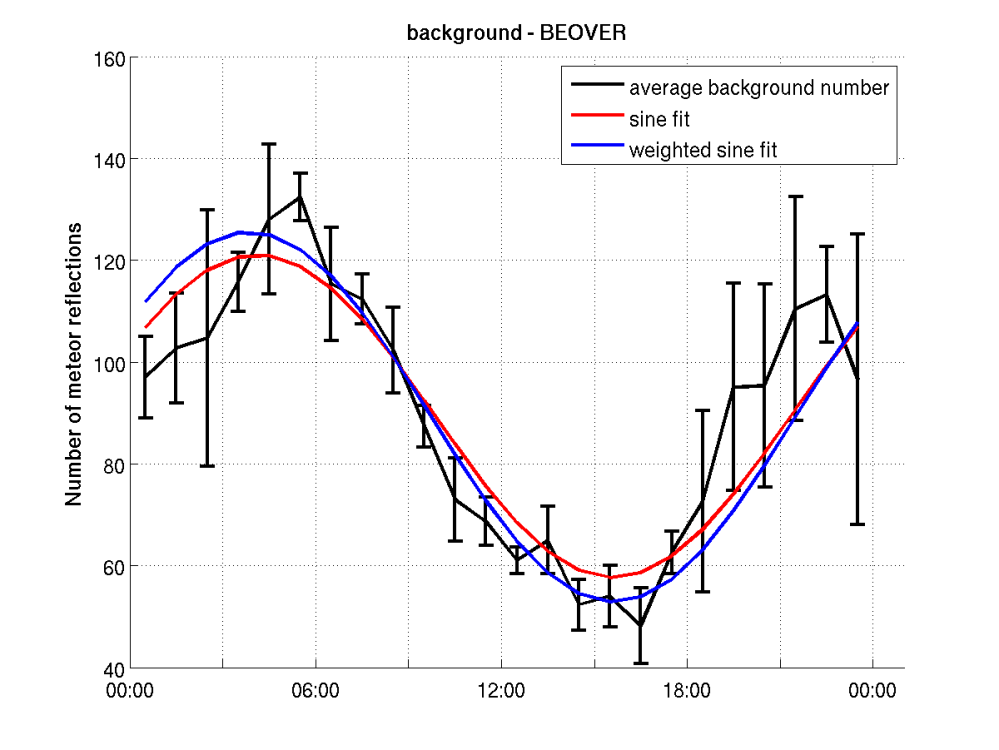
Because the daily variation of the background is due to Earth’s rotation and displacement in space, we expect more or less a sinusoidal variation with a period of 24h. Of course the sporadic activity might deviate daily from this sinusoidal variation. But since the variation of 2 days in July might not exactly reflect the activity in mid-August and because there is some scatter in the data, we have decided to fit a sinusoidal variation to the average curve above. The free parameters are then the amplitude and the phase of the sine while the period is fixed and equal to 24h. The results are shown in Figure 2.
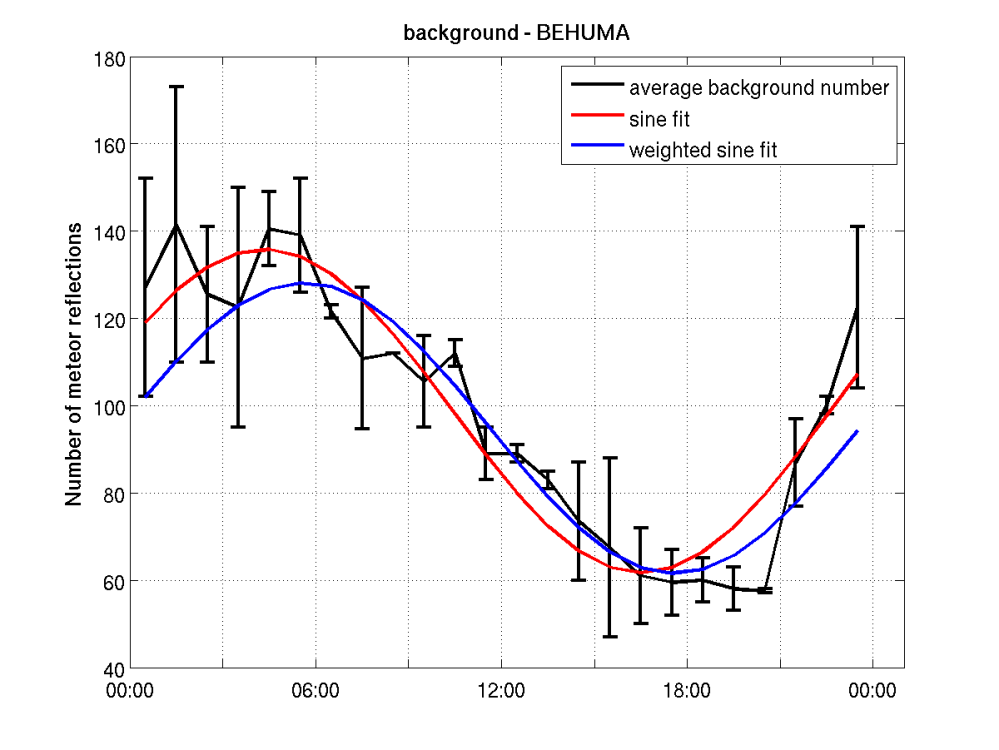
Figure 2 : sine fit (red curve) and weighted sine fit (blue) of the average background curve for BEHUMA station.
We try two fits : the red curve is obtained by considering all 24 points equally, i.e. by neglecting error bars. The blue curve is obtained by giving more weight to the points with small error bars. The second approach is in principle better. However, because these error bars are constructed from only 2 points, we have to be careful that some points from the individual curves are just randomly close to each other. The best example is the point at 08:00 which has a null error bar because by chance the same number of meteor echoes have been counted on data from 22 and 23 of July. Also the error bar is very small at 20:00. In order to not give too much weight to these points, we set up a limit for the weights under which we replace the values by something related to the median of the distribution of weights. As we gather data on more meteor showers, it will become clear which of those two sine fits performs best.
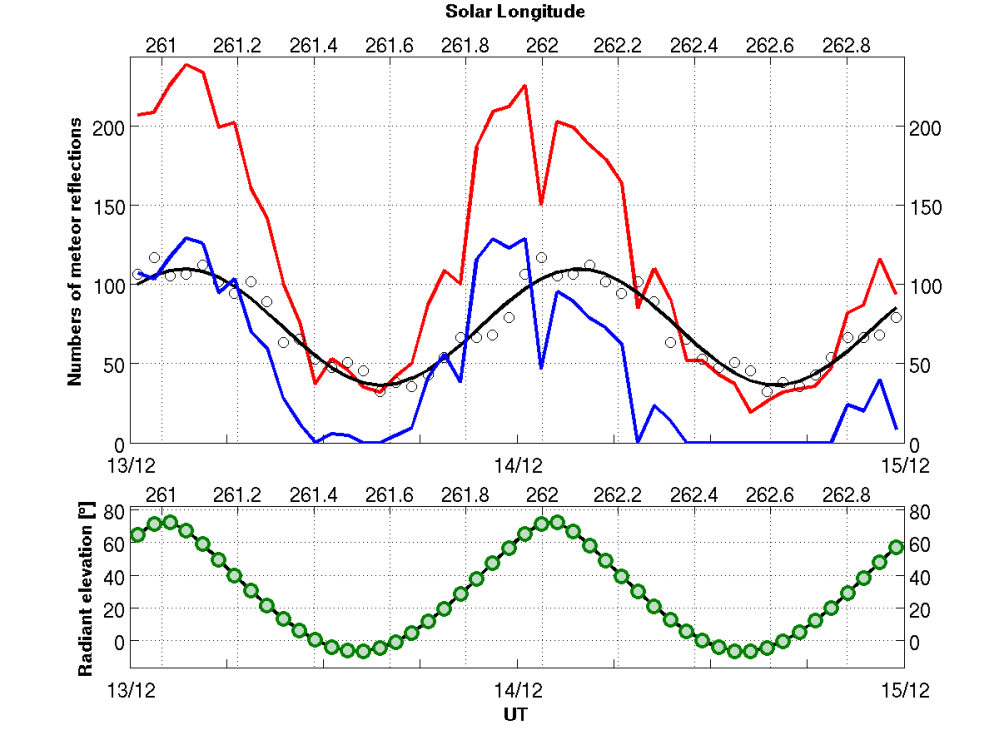
Now we can have a look at the activity curve measured on 11-13 August. It is shown as the red curve in Figure 3. The white dots and black curve are the average hourly background activity and corresponding sine fit curve from Figure 2. The blue curve is the subtraction of the black curve from the red curve and is supposed to represent the activity of the Perseids. Below is also shown the elevation of the radiant as function of time. When the radiant is too low on the horizon, the ionized meteor trails are too low and cannot reflect the radio wave and indeed we see that the number of meteor reflections become equal to 0 or close to 0 when the radiant is at the minimum (around 18h UT every day). Also when the radiant is at its highest elevation in the sky, the geometry is not very favorable for radio meteor detections and we also expect to observe small dips in the distribution (around 6 UT every day).
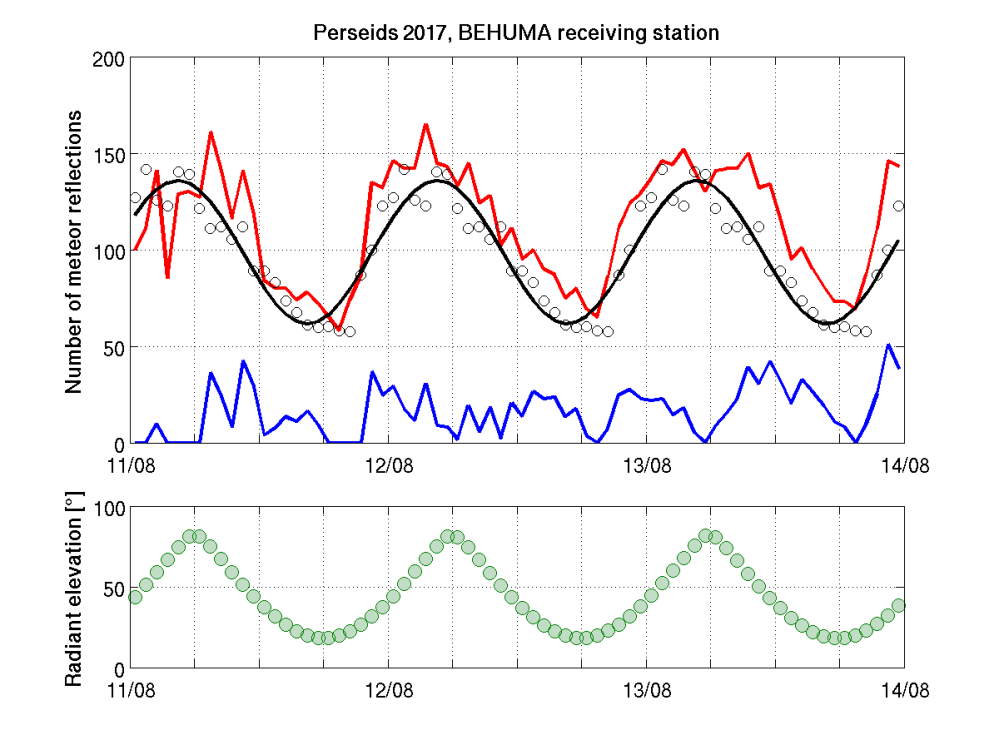
Figure 3 : Number of meteor echoes detected between 11 and 14 August at station BEHUMA.
The Perseids do not appear clearly in this graph for two reasons: 1) they activity was moderate and therefore do not overcome strongly the contribution of the background 2) the peak of activity observed visually by observers around the world was on August 12 around 18h UT, i.e. very close to when the radiant of the shower was at its minimum elevation for us. This can be seen e.g. on this activity graph of the IMO (International Meteor Organization).
In order to better see the activity of the meteor shower, there are two other possibilities :
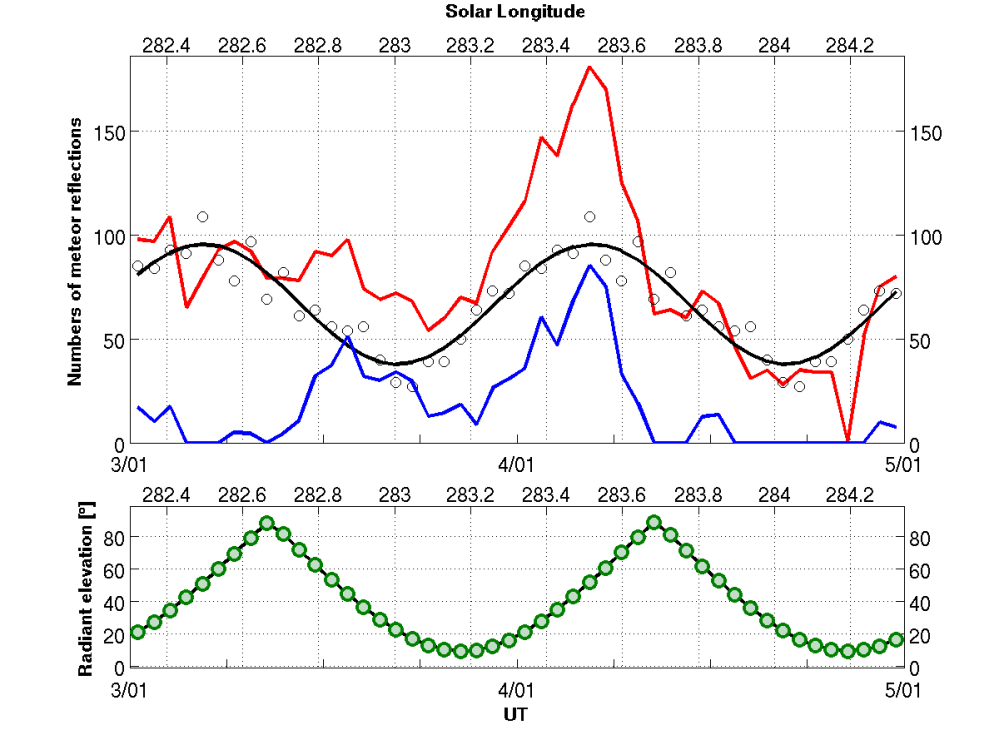
- We can look only at meteor reflections lasting more than 10 seconds, namely the overdense meteor echoes. Indeed, those ones appear far more often during the Perseids than in the sporadics, and so the contamination by the background will be minimal. These long-lasting echoes include most of the epsilon-like, c-like or corkscrew-like meteor echoes that everyone likes to spot in our spectrograms. The results are shown in the figure 4 below :
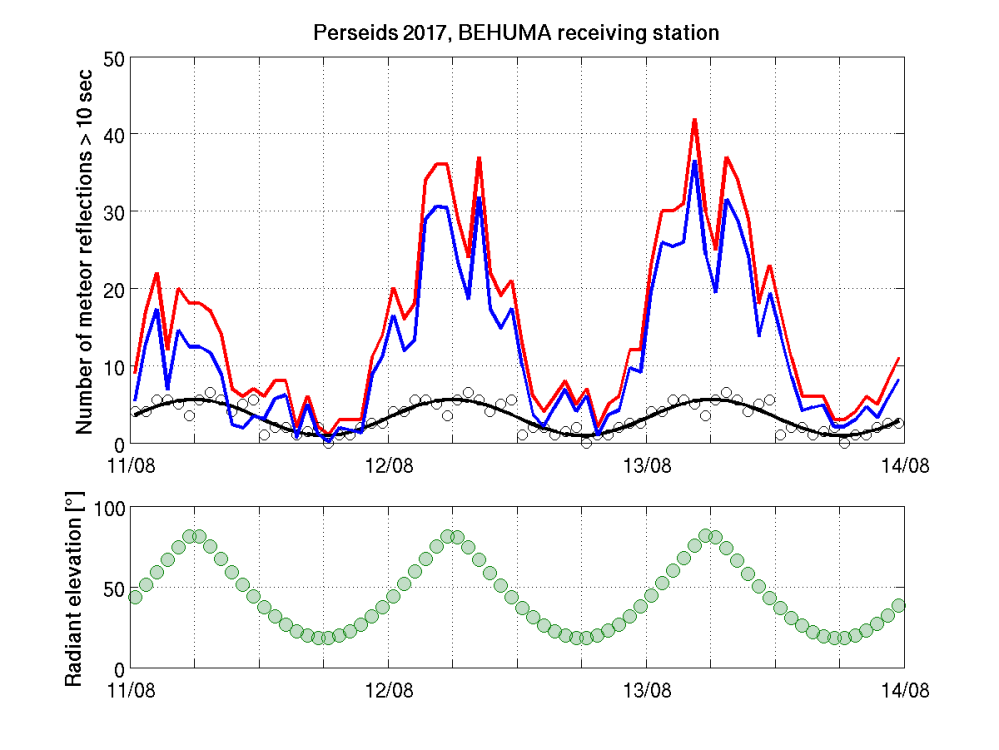
Figure 4: Number of meteor echoes lasting longer than 10 seconds detected between 11 and 14 August at station BEHUMA
In figure 4, the background (black curve and white dots) is much smaller than the blue curve that represents an estimate of the activity of the Perseids only. Therefore two peaks of activity on 12 and 13/08 are now clearly visible and are larger than the activity on August 11. They represent respectively the ascending and descending parts before and after the maximum activity that we unfortunately could not really detect with our network (due to the low elevation of the radiant). However, during this peak of activity around 18h UT on 12/08, there seems to be a small increase of meteors. We need to look at this in more detail before confirming if this small increase is real or not.
- A second method to emphasize the activity of the Perseids is by plotting the duration of the meteor echoes (roughly estimated via the width of the rectangles). Indeed, the long overdense meteor echoes will then dominate and this can be seen in Figure 5.
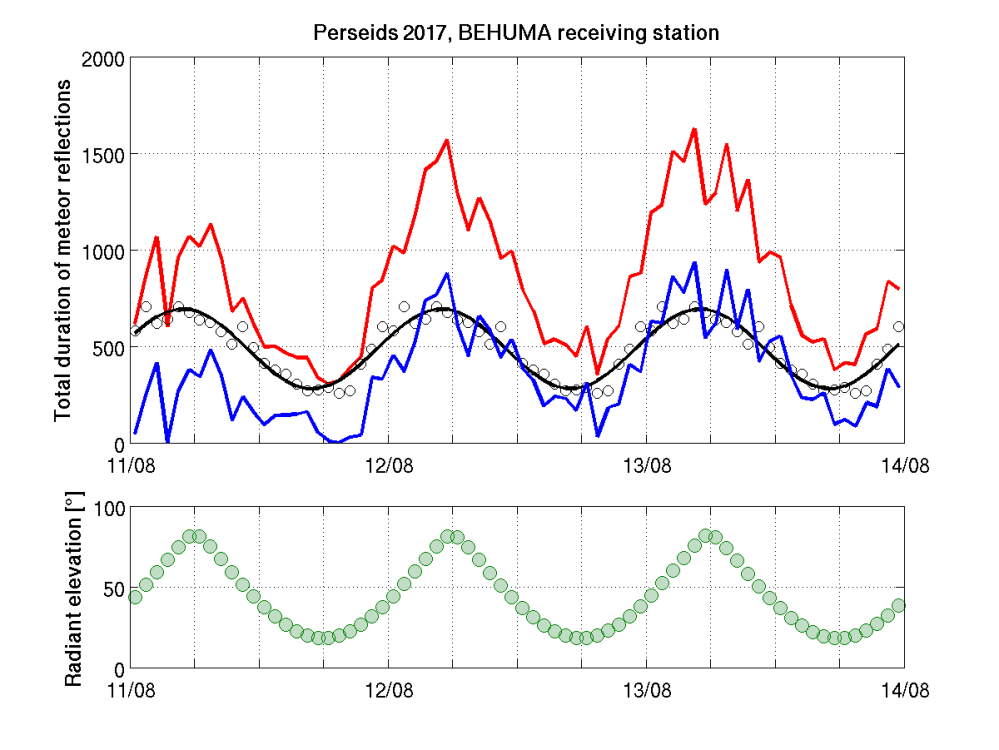
Figure 5: total duration of meteor echoes between 11 and 14 August for the station BEHUMA.
The two peaks are now clearly visible as well even if we include all detected meteor echoes. Also, quite interestingly, the small peak around 18h UT on 12/08 is rather visible as well and could be due to the maximum activity of the Perseids happening around this hour.
What will be next?
-
We want to compute the same activity curve for 2 other stations, namely the ones in Ottignies (BEOTTI) and in Overpelt (BEOVER) for the same days (11-13/08 for the meteor shower and 22-23/07 for the background). The activity days have been mostly processed. We are starting to upload the background days.
-
Once everything is done, we can compare the results. Indeed because the three stations are located at different distances from the transmitter and along an axe Transmitter-Receiver that is at a different angle relative to the position of the radiant of the Perseids, the meteors detected might not be the same, at least for the underdense meteor echoes. The relative numbers might be different depending on the sensitivity of each receiving station. Nevertheless, we should observe more or less the same behavior in the activity curve (e.g. positions of the peaks)
-
It should be better to include one or days of background obtained after the Perseids such that the average curve will be better (with 4 days instead of 2 we should observe less scatter) and we will also make an average of the background behavior before and after the meteor shower.
-
It will also be very interesting to compare the results of the background from last year to those of this year and see if and how the background changes from year to year.
-
The activity curves of the meteor shower are not the final products. These are only raw counts for meteor echoes. As mentioned above, e.g. when the radiant is low or high on the horizon, we are not able to detect as many meteor echoes. This can be corrected for by dividing the results by the so-called “Observability Function” which takes into account all the geometrical factors such as positions of transmitter and receiver and position of the radiant throughout the day. After this correction, we may obtain a “true” activity curve instead of the “apparent” activity curve.
-
We also plan to check the influence of the aggregation method used to provide the final detections from individual rectangles drawn by the individual users.
We will keep you updated. Meanwhile please note that these results will be presented during the International Meteor Conference 2017 in Petnica, Serbia, and at the European Planetary Science Congress 2017 in Riga, Latvia.
Estimation of the background activity (16 June 2017)
First of all, thank you for your continuous effort since the launch of the RMZ on August 12 2016. All the results have been or will be used. In the next few days, we would like to give an update on our activities with the RMZ data. Today's discussion/topic is about estimating the background activity.
First, we are analyzing data from 4 meteor showers, each with data from a different number of stations :
Perseids 2016 : 8 stations
Geminids 2016 : 5 stations
Quadrantids 2017 : 2 stations
Lyrids 2017 : 1 station
For each of these meteor showers and stations, we compute the total meteor activity which is the number of meteor echoes detected per hour. This activity is due partly to the meteor shower but also partly to the sporadic meteors that occur every day and constitute the bulk of meteor echoes usually detected by the BRAMS network. This background activity must somehow be subtracted in order to identify the contribution from the meteor shower itself. Although it displays a well-known daily variation with a maximum in the morning and a minimum in the evening, the exact values can vary daily. In order to estimate and subtract it as correctly as possible, we have uploaded several days of data during periods where the meteor shower is not active, either before or after the meteor shower, or both whenever it was possible. For example, for the Geminids 2016, the meteor shower activity was measured on December 13-14 and the background activity was measured on 5, 10, 16 and/or 17 December.
To analyze the background data and produce an activity curve (total number of meteors per hour), we adopt the following procedure :
- we take the average of daily values for a given hour
- we compute an error bar which is the standard deviation of individual values
Here is an example of data obtained before and after the Geminids 2016 for the station in Overpelt:
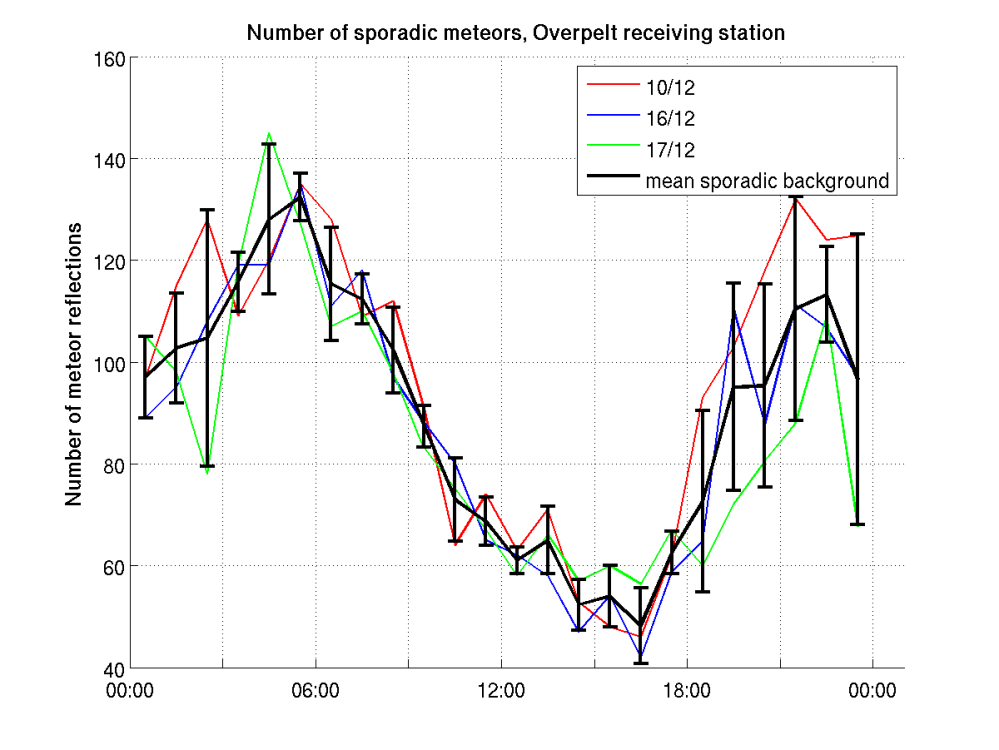
Three individual days are shown : 10, 16 and 17 of December, respectively in red, blue and green. The mean/average of these 3 days for each hour is given as the black curve and the error bars are attached to each point and shown vertically. They measure the scatter of data from individual days. A clear pattern is visible with a maximum during the night/early morning and a minimum in the late afternoon. This is a daily variation due to the displacement of Earth in space along its orbit with an orbital speed of around 30 km/s (19 miles/s). The front side of the Earth with respect to this movement will sweep up more meteoroids than the backside. Since the local time at the front side of the Earth is always around 6h local time, the maximal sporadic meteor rates will occur around 6h local time while the minimum number will occur near 18h local time.
Due to this well-known variation, we expect the background to have a more or less daily sinusoidal variation. Hence, the next step is to fit a sine curve to the hourly average (black) curve shown above. The result is shown below :
We plot two possibilities for the fit, either without taking error bars into account (red curve) or with the error bars (blue curve). In the latter case, we must be careful to not include too small error bars that randomly result from daily measurements being very close to each other. This can happen because we consider only 2 or 3 days for the background (as each day requires approximately 3000 classifications and therefore takes some time). We are currently testing how to do this in the most clever way.
Activity plot of the Geminids 2016 meteor shower
Once again thank you very much for your continuous efforts in identifying meteor echoes in our spectrograms. We have now preliminary results for the Geminids 2016 for 2 stations BEOTTI (Ottignies) and BEOVER (Overpelt). These stations are located in slightly different directions but at very different distances from the transmitter and so they probably have not so many meteor echoes in common (a more detailed and careful analysis later will give a better estimate of this), still we expect to find similar results in terms of meteor shower activity. Below again we present first the activity profiles (number of meteor echoes per hour) for both stations. The red curve is the total activity between 13 and 15 December. The black dots are an estimate of the hourly activity of the sporadic background, based on data obtained from December 10 (before the Geminids) and December 16 and 17 (after the Geminids). The sinusoidal curve is the best fit to these black points (see also topic on Perseids for more details). The blue curve is the total activity minus the best fit for the sporadic activity and is therefore an estimate of the activity of the Geminid meteor shower only. Please note that for BEOTTI there is a gap of missing data on December 13 between approximately 17h30 and 20h00 UT as these data were mistakenly not uploaded to the Radio Meteor Zoo. They are analyzed currently and the graph will be updated later.
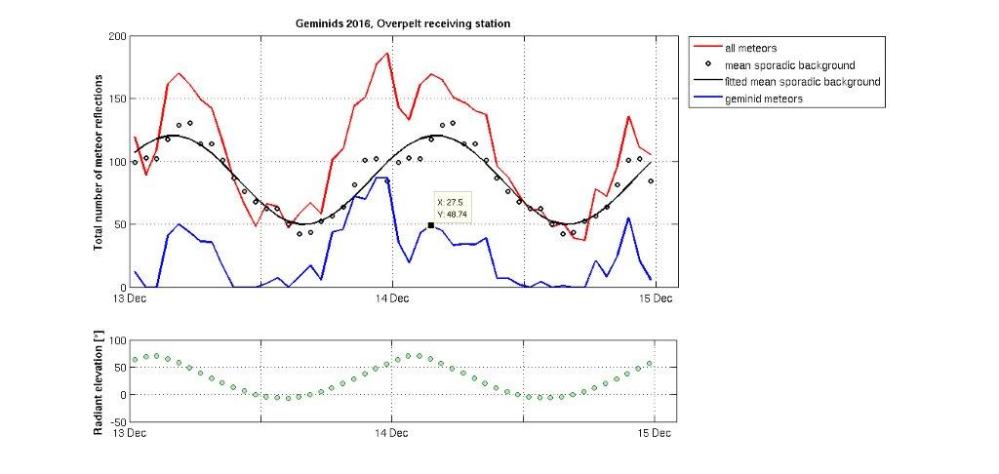
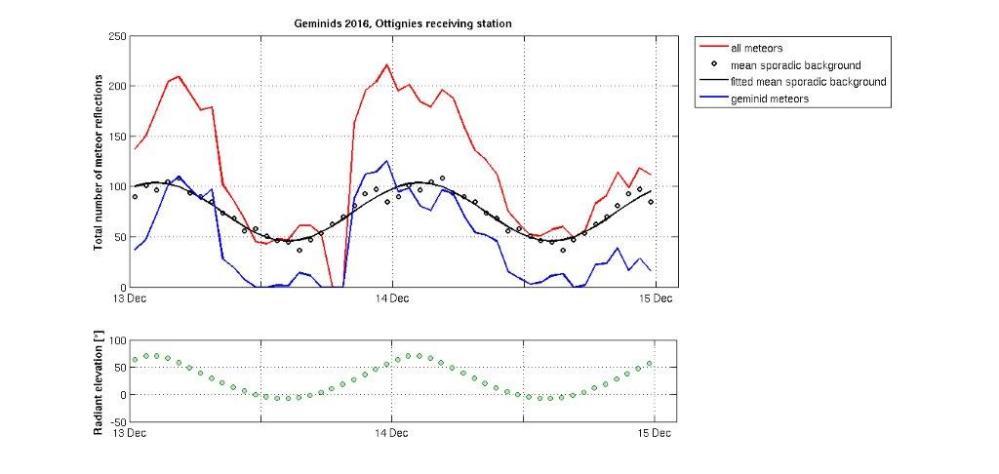
As expected, the meteor shower activity is zero when the radiant of the meteor shower is very low or below the horizon (the green dot curves below the activity curves). Also both activity curves show a maximum slightly before midnight, which is an agreement with visual observations. A second peak later during the night is also visible on both stations although less striking.
As for the Perseids, the activity curve and in particular the peaks are more clearly visible when we select only those meteor echoes which last at least 10 seconds (here based only on the size of the rectangles).
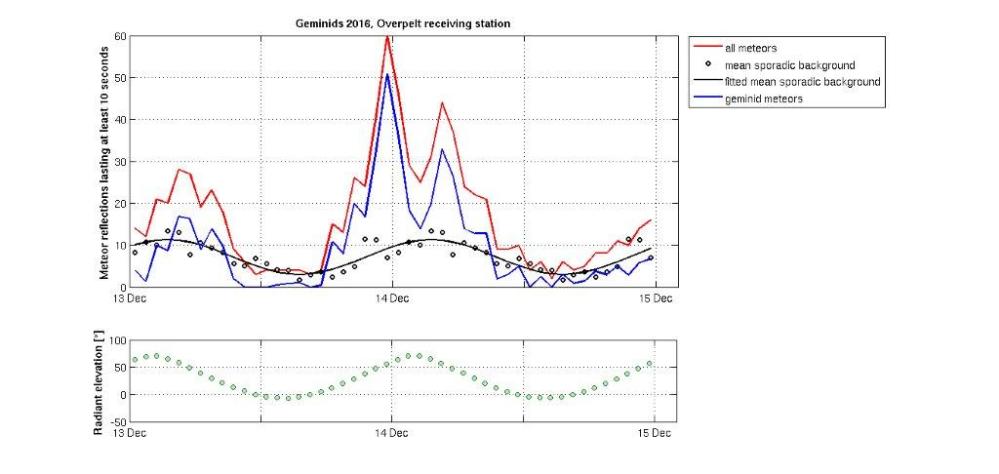
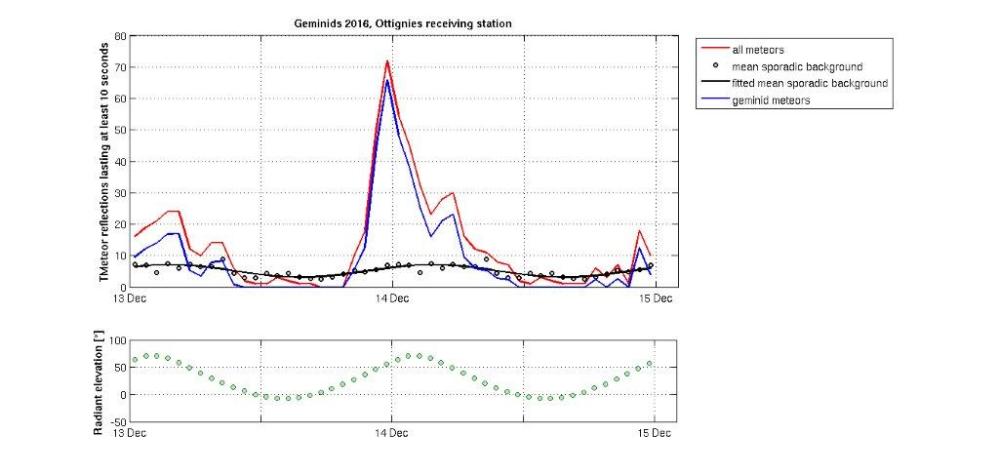
There the two peaks are clearly visible since most of the reflections longer than 10 seconds are stream members, so the stream members are diluted much less by the sporadic meteors than in the case of all reflections. The two peaks appear at the same time for both locations which is expected as the directions between the transmitter and both stations are rather similar. The intensity of the peaks however can be different depending on both the sensitivity of each station (different local noise, length of the cables, calibrations of the antenna, etc...) and on the distance between the transmitter and the receiving station. To take that into account, we will work in the next few weeks on the observability function, which takes these parameters (and a few others) into account to "convert" raw counts of meteor echoes into something more easy to compare from station to station. Nevertheless, these primary results are very encouraging and we would like once again to thank you for your efforts.
Next we will post results from additional stations for the Geminids (BEHUMA, BETINT and BENEUF) which are geographically close to each other. And right after, given the success of the Radio Meteor Zoo, we will upload data from another meteor shower, namely the Quadrantids 2017, for which the peak of activity was around January 3rd. More details soon.
Activity plot of the Perseids 2016 meteor shower
Here is one of the results obtained so far for our station in Humain. It shows the meteor activity recorded at this station between August 10 and August 14 with data plotted per hour (so we sum up all the meteors from the 12 individual files of 5 minutes duration each).
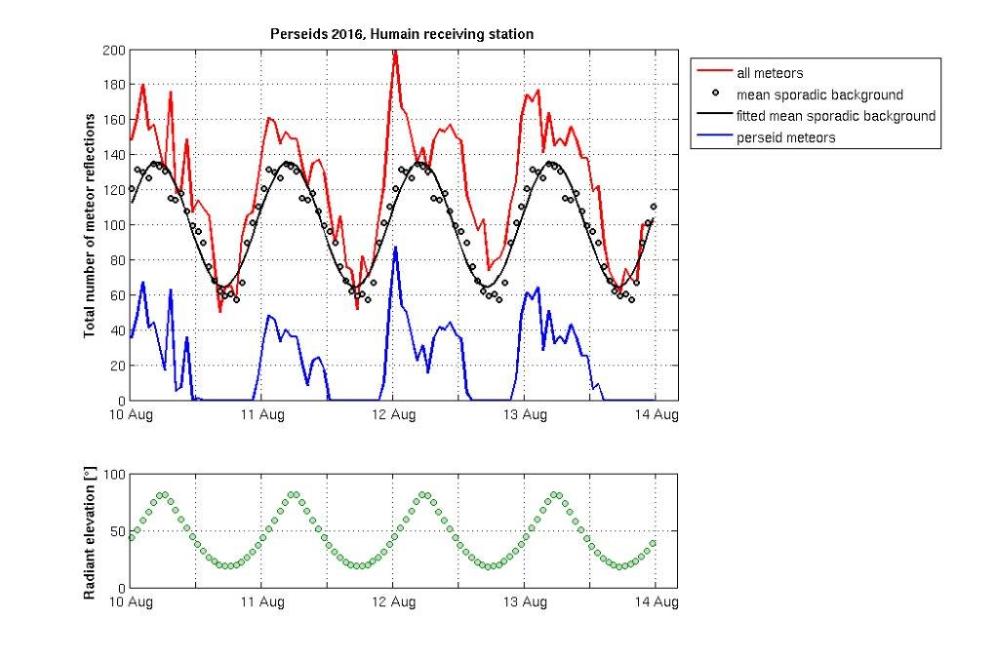
The red curve shows all meteors counted by the RMZ users and is the total activity. This activity is due on one hand to meteors belonging to the Perseid meteor shower and on the other hand to the so-called sporadic background (meteors occurring all the time and coming from different sources).
The black dots are hourly measurements of the sporadic background, obtained using data from 2 days after the meteor shower, namely 17 and 19 of August, when the Perseids were not active anymore and no other meteor showers occured. The dots are average values of the two days. The black curve is the best fit of the black dots using a sinus variation with 24h period. Indeed it is a well-known result that the sporadic activity varies daily due to the Earth's rotation. Every day, the sporadic background displays a maximum around 6 AM when the Earth faces the direction it is moving to, and a minimum around 6 PM.
The blue curve is the result of subtracting the best fit (black) curve from the total activity (red) curve. It displays activity from the Perseids only (or mostly as the correction for the background is only approximate). When the subraction was giving a negative result, it was set to 0. In the graph below, the green dots represent the elevation of the radiant of the Perseids, which is the point on the sky where all Perseid meteors seem to originate from. For the Perseids, this point is located in the Perseus constellation, hence the name of the meteor shower. Of course, due to the Earth's rotation, this point moves in the sky during the day and this is what is depicted in the bottom figure. What can be seen is that when the radiant of the Perseid is low on the horizon (small elevation), there is no activity from the Perseids that is detected by our BRAMS network. On the other hand, when the radiant is very high on the sky, the conditions for reflections of radio waves are not so good either and we indeed observe a small dip in the blue curve when the radiant is at its maximum elevation.
The peak of activity of the meteor shower was on 12 August, after midnight UT, and is clearly seen from these results. The next step (work in progress) is now to "correct" the activity of the Perseids (blue curve) by using the so-called Observability Function. This function takes into account the geometry of the system (positions of the transmitter and receiver, position of the radiant in the sky) and the corresponding sensitivity in order to provide a correcting factor to relate the raw counts (plotted above) to real numbers of meteors. For example, at a given time (and so a corresponding given elevation of the radiant), some meteors cannot be detected by the system made of our transmitter and the receiving station in Humain. The link between what can be detected and what is actually detected is called the observability function.
The Perseid meteor shower can be more easily distinguished from the sporadic background when looking at long overdense meteor echoes. In the figure below we show the same quantities as above but only for meteor echoes lasting more than 10 seconds.
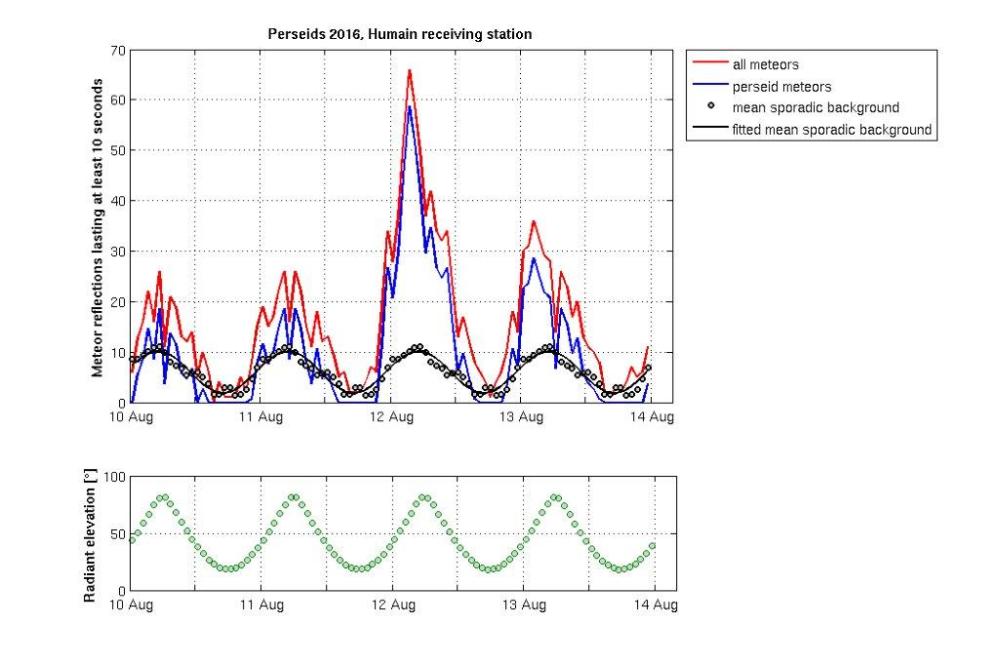
The total numbers are of course much lower than in the first graph above but the contamination of the Perseids by the sporadic background is much lower. Hence the two peaks of activity (the big one right after August 12 midnight and the second one on August 13) are more easy to spot. The fact that Perseids appear more clearly when looking only at long overdense meteor echoes is related to the so-called mass index of this shower. The mass index of a particular meteoroid population describes how the masses of the particles are distributed : a large mass index indicates there is more mass in smaller particles, whereas a low mass index indicates there is more mass in larger particles.
First result: Quadrantids 2016
During the beta phase of the Radio Meteor Zoo, you identified meteors that were observed by the BRAMS station in Uccle between 1 and 7 January 2016. During this period, the Quadrantids meteor shower was active. Its proposed parent body is the extinct comet 2003 EH1.
The maximum of this meteor shower was on January 4. Video observations suggested that there were actually two peaks, which is now confirmed with the BRAMS radio observations thanks to your contribution!
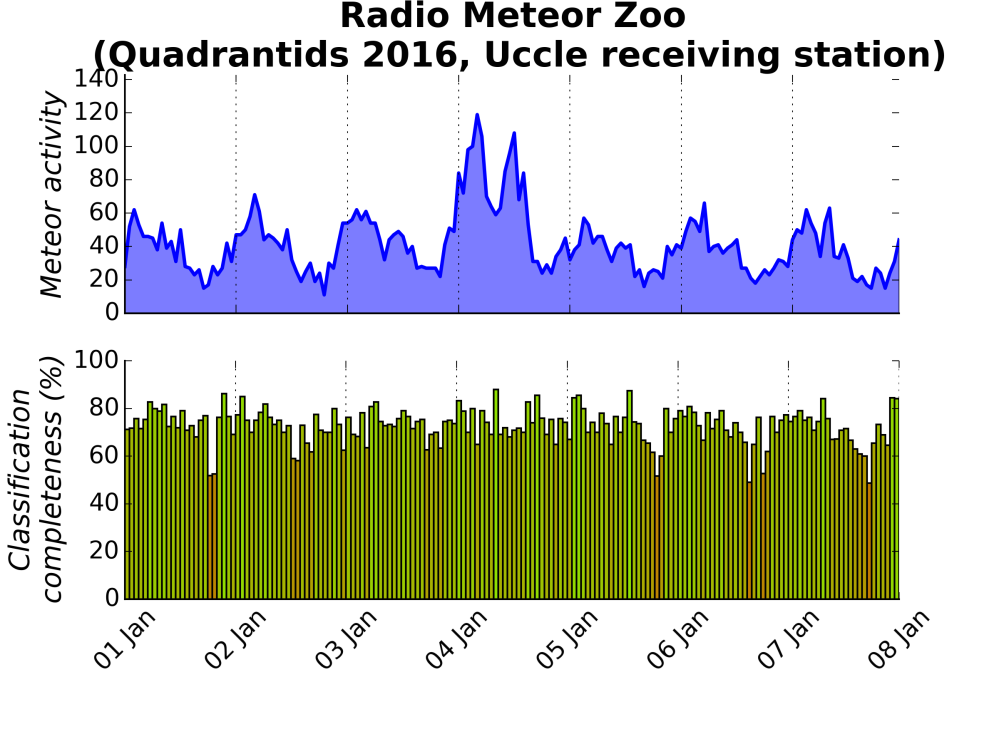
As you can see, the peak of the Quadrantids is quite sharp. So most of the meteors you spot on that days before or after January 4 are probably sporadic ones (=dust in our solar system which is not associated with a comet or asteroid). Nevertheless, we still see a lot of meteors during the morning hours. This is called the 'diurnal effect'.
Why do we have the diurnal effect? In the morning, we are at the same side of the Earth as its movement around the Sun, so stationary meteoroids (relative to the Sun) are caught by the Earth's atmosphere. In the evening, we are at the back of the Earth: meteoroids need to have a speed that is bigger than the Earth's orbital speed to be burned in the Earth's atmosphere.