The Lyrids 2026 campaign has ended.
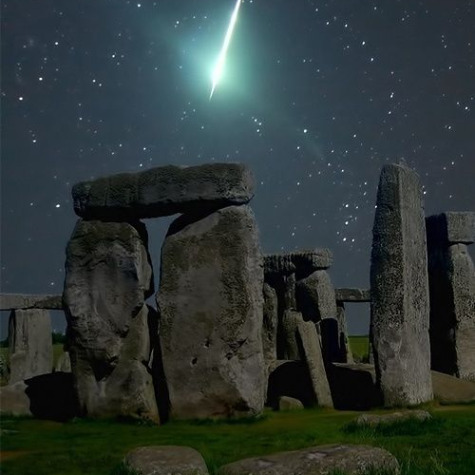
We now move on to the Arietids and zeta Perseids, the strongest daylight meteor showers of the year. First discovered at Jodrell Bank Observatory in England in 1947, these showers occur when Earth passes through dense streams of meteoroids in space. Their peaks often overlap, and the parent bodies of both showers are still unknown.
Thank you for your support!
FAQ
Example of a very busy spectrogram during active meteor showers and how to count meteor echoes then
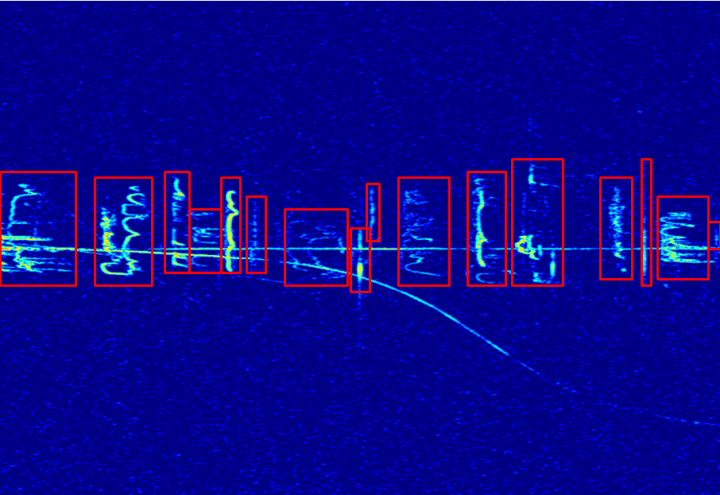
As explained in the tutorial, meteor echoes produced during active meteor showers can display extremely complex shapes. These are the ones we are the most interested in because automatic detection algorithms fail to detect them correctly (so far).
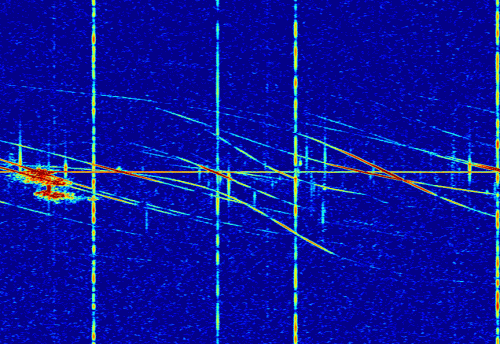
Here is an example of an extremely busy spectrogram which was recorded during the peak activity of the Perseids on August 12. This gives you an idea on how to draw the rectangles around these complex shapes. Sometimes they overlap. It does not matter if your rectangles overlap but whenever possible try to avoid it.
A meteor echo may be (is often) discontinuous; how far 'out' (vertically) should we go?
As explained in the last part of the Research section, the horizontal axis is time and the vertical axis is frequency. So vertical structures are happening simultaneously with very high probabilities that they are related to the same meteor.
So how far out do you have to go? This is an example of how we do it:
The chance that two meteors are simultaneously observed with one station is quite low, so you can assume most of the time it is the same meteor. Two examples:
What if I miss a small part of the meteor echo when I drew my rectangle?
In these images, power is related to color, red indicating a very large power while blue indicates very low power (close to what we call the background noise), blue and green being intermediate powers. But the scale of this color coding is not linear, the red parts contain most of the meteor echo power. So if you miss a little part in a meteor echo that is a bit disconnected and close to the background, it is not too critical. We will check later the vertical/frequency extent of all the meteor echo candidates provided by this project.
How 'disconnected' should two signals be, before we mark them separately?
There is no clear and non-subjective answer to this question. If you see two echoes that are "connected" by at least one pixel, consider them as one meteor and draw only one rectangle.
However, if you cannot spot any connection between them, they have to be identified as two separate meteors, no matter how close they are.
What is the maximum frequency/vertical extent of a meteor echo?
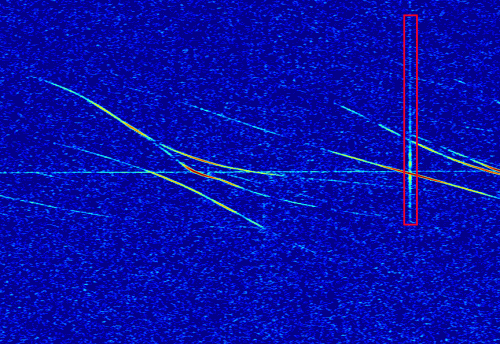
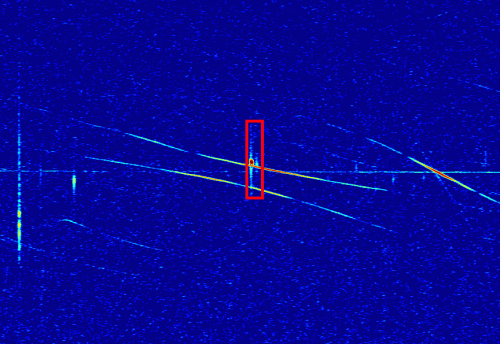
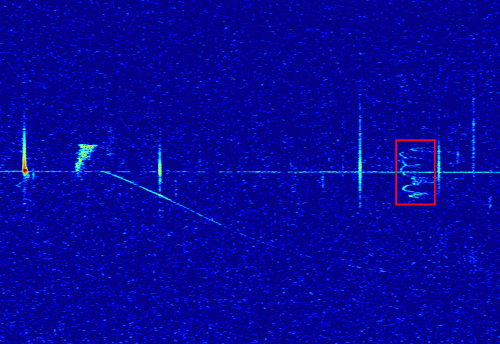
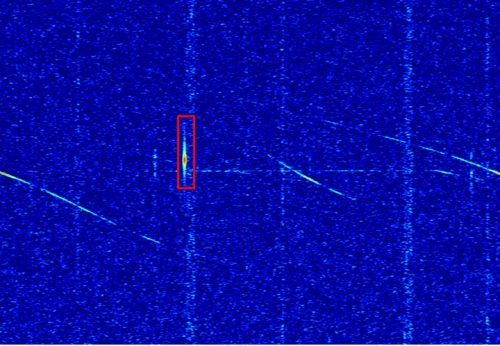
Most of meteor echoes will appear rather close to the central line/reference frequency with a rather limited vertical extent. However, in some cases, meteor echoes can reach the border of the image, mostly the top one. Look at this example:
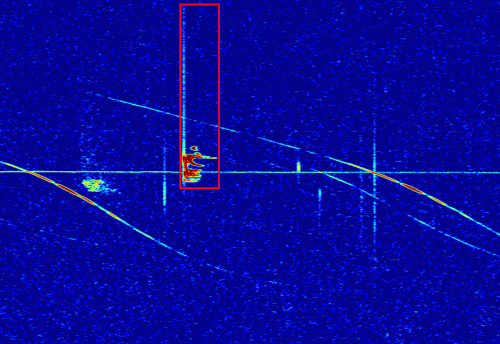
The vertical line at the beginning of the signal is a so-called meteor head echo. Normally meteor echoes are due to the reflection of the transmitter wave on the ionized trail that is left behind after a meteoroid has entered the atmosphere. These echoes are called trail echoes and constitute the bulk of meteor echoes detected by the BRAMS network. But in rare cases we receive also the reflection of the transmitter radio wave on the ionized shock in front of the meteoroid body moving through the atmosphere. These ones are called head echoes. They are usually followed by an overdense trail echo, which is often quite bright. The example above is an extremely bright example.
When is a meteor echo too faint to draw a rectangle?
Here again, there is no clear and unambiguous answer. The eye is extremely good at detecting structures in the noise, while latter when you analyze the same data with a program it won't detect anything. So the answer is a bit subjective.
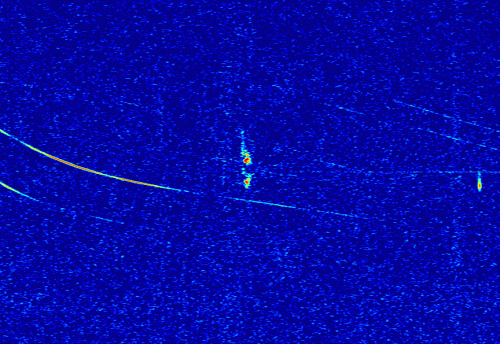
Here are two examples of very faint and complex meteors:
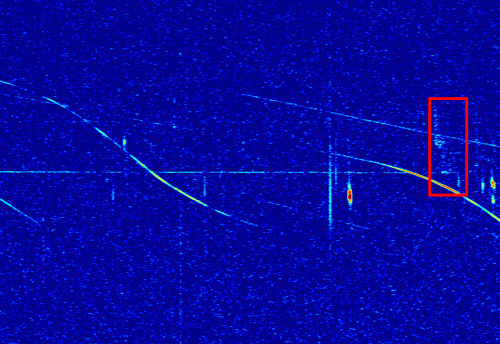
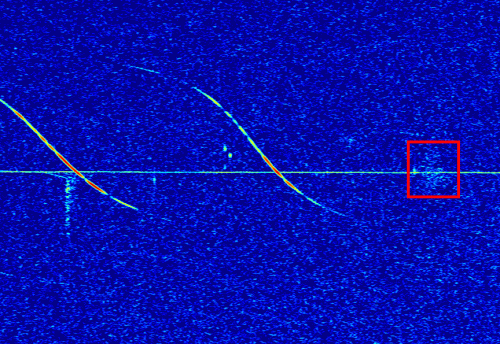
These echoes are long and so should definitely be considered as overdense meteor echoes. The reason they appear faint is because the ionized trail is located far from the receiver and so the reflected radio wave must travel a greater distance and gets strongly attenuated. These examples should hopefully give you some guidance on how faint meteor echoes can appear in these images.
How complex can the shape of a meteor echo be?
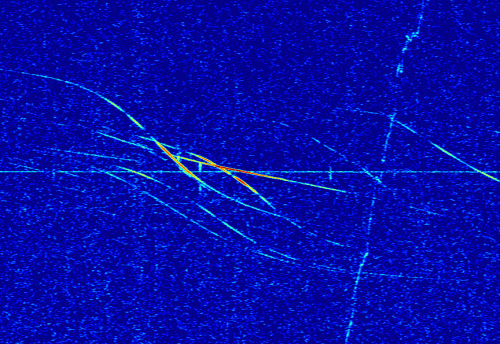
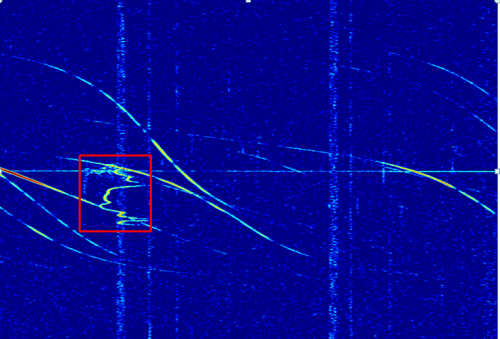
Most meteor echoes are underdense and will appear only as vertical lines. Overdense meteor echoes can take many complex shapes including what we call in our jargon "C meteor echo", "epsilon meteor echo" or "multi-branches meteor echo". These names are related to the shapes of these echoes in spectrograms. Here are some more examples of complex meteor echoes observed during the Perseids in 2015.
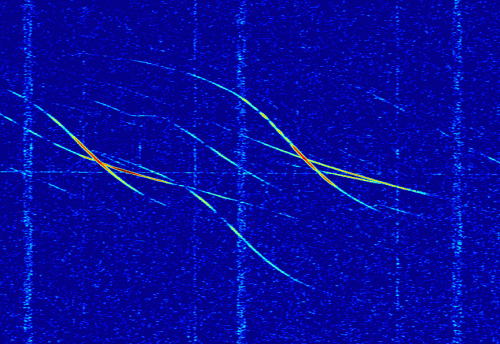
Here is a very nice example of "epsilon echo" or "multi-branches meteor echo".
What is the physics behind a epsilon echo?
We are honestly not sure. Simulations should be made to explain why at a given time, several signals are received at different frequencies. One tentative explanation is that for these long duration overdense meteor echoes, while the electrons are scattering into the neutral atmosphere, the trail can be distorted or "broken" into several pieces by strong shear winds at high altitudes. This would result in multiple reflections of the wave appearing at different frequencies because of the differences in speed in reference to the transmitter (Doppler effect). But once again this should be simulated and reproduced before we can conclude on this topic.
Those epsilon-like or multi-branches echoes are observed much more often during meteor showers, also explaining why we need human eyes to recognize them as automatic detection algorithms very often fail at detecting these complex shapes.
Why is the beacon signal not visible in some images?
The direct signal from the beacon is not so direct. The radio wave mostly propagates in the troposphere (region of the atmosphere going from the ground up to altitudes of maximum 15-20 km). Sometimes propagation conditions are not optimal and the signal might be very weak or absent. An example is given below. This signal is called "direct" by comparison with the reflected signal off the ionization trail that goes up to altitudes of around 100 km.
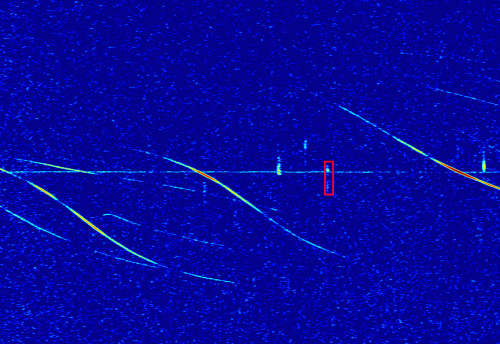
What is this strange drifting signal?
It is most probably due to an artificial (man-made) transmitter whose signal is drifting in our frequency band. It is definitely not a meteor echo. Do not select these.
My image is full of vertical signals. What are these?
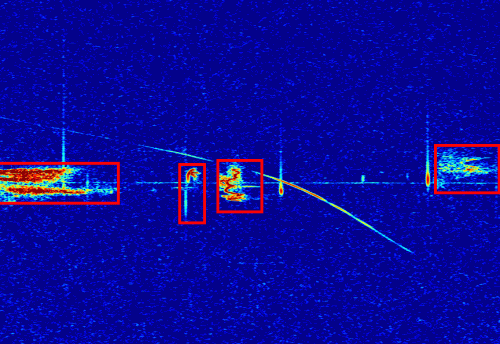
Radio observations can be performed during daylight and when the sky is cloudy. This is a big advantage over optical observations. However, there are cases where radio observations are strongly affected by weather conditions, namely when thunderstorms occur nearby the receiving station. The lightnings produce very strong broad-band interference that appear vertical in our spectrograms. The closer the lightning, the brighter the interference. When the thunderstorm is very active, many distant lightnings can perturb the data and these results in very messy spectrograms. See examples below. We have tried to remove those useless data from the data set of the Radio Meteor Zoo.
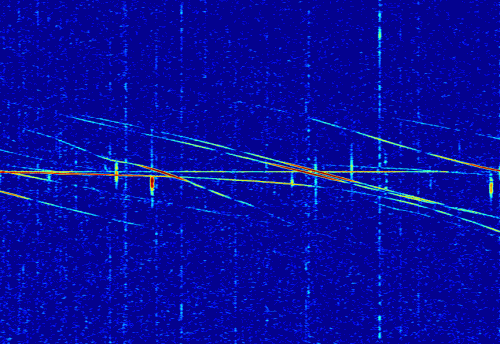
The first example shows 4 very bright interferences due to lightnings probably close to the receiver. The spectrogram is still useful.
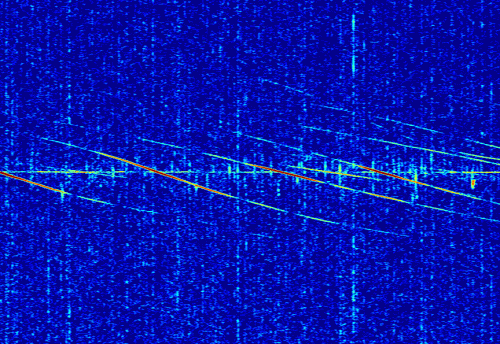
The second example shows a lot more vertical interference but also fainter, so probably due to more distant lightnings. The spectrogram becomes more difficult to use but most meteor echoes can still be spotted.
The third and final example shows an extreme case of a very active thunderstorm and the data become useless during this period.
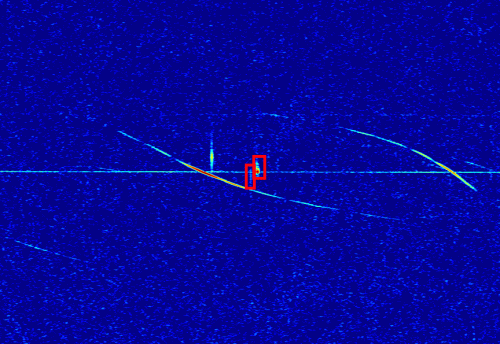
My image contains several vertical bands. What are these?
The image below is an example of such an image. These bands are also interferences. This is the case every time a signal spans the whole frequency range. The fact that these bands appear regularly in time indicates that it is most probably man-made. For example it could be an instrument emitting in broad-band. It should not and it's probably not even realized by the instrument owner.
Since these interferences span a non-negligible part of the image, it can happen that meteor echoes fall in these bands. In that case you must select the meteor and you can draw the rectangle through the interference band. Two examples are shown below : first, a short/underdense/vertical meteor echo and second, a complex epsilon-like echo.
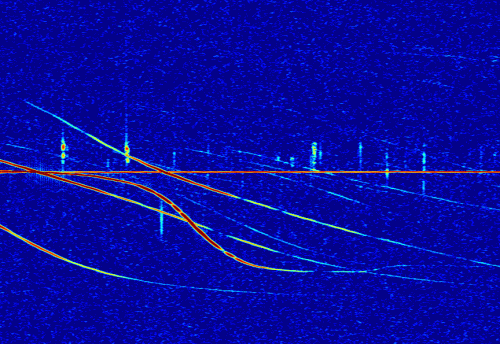
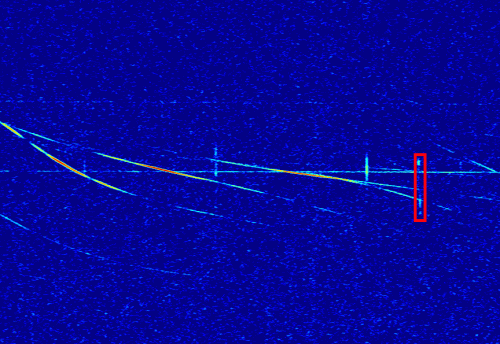
There are a number of very faint and numerous vertical structures near the beacon frequency. What are they?
Sometimes the signal received by one of our station saturates the receiver and some artifacts may appear. They mostly appear when several very bright airplane echoes (so appearing red in the spectrograms) superimpose. These are NOT meteor echoes so do not select them. In the example below, you can spot such an artifact to the left near the central frequency, where two very bright airplane echoes overlap.