


Results
OceanEYEs Results Page
Updated April 11, 2021
OceanEYEs reached the 1 million classifications mark on Feb 24, 2021. As we pass 100,000 fully classified images, we would like to give you, our wonderful volunteers, an update on some of the project results thus far.
Project Stats
Total images processed to-date (09/15/2020): 131,428
Total annotations: ~3,296,000
Average number of annotation per day: ~16,000
Demographics:
Geography
- USA: 63%
- California: 18%
- Texas: 7%
- Hawaiʻi: 6%
- UK: 13%
- Canada: 3%
- India: 2%
- Germany: 2%
Age
- 8-24 yrs: 30%
- 25-34 yrs: 26%
- 35-44 yrs: 15%
- 45-54 yrs: 11%
- 55-64 yrs: 9%
- 65+: 8%
Beta Test
In the fall of 2019, the OceanEYEs team conducted a beta test to see if citizen scientists - like yourself - could produce accurate annotations that could be used to develop new ways to count fish within underwater video and to train new machine learning classifiers to eventually automate the entire process. We started by uploading a total of 100 images, 70 of which contained fish and 30 of which contained no fish. Each of these images was annotated by 15 random citizen scientists like yourself. We scored the accuracy of your annotations against “ground truth” annotations made by researchers here at the NOAA Pacific Islands Fisheries Science Center.
When conducting the beta test, we focused on four main questions (listed in order of importance):
- Are there fish in the image (presence/absence data)?
- How many fish are in the image (count data)?
- Where are the fish in the image (positional data)?
- What species of fish are in the image (species identification data)?
The first step was to use a variety of tools provided by Zooniverse - as well as some of our own Python code - to consolidate each of the 15, independent annotations for a given image into what we call a “consensus” annotation. (see Figure 1).
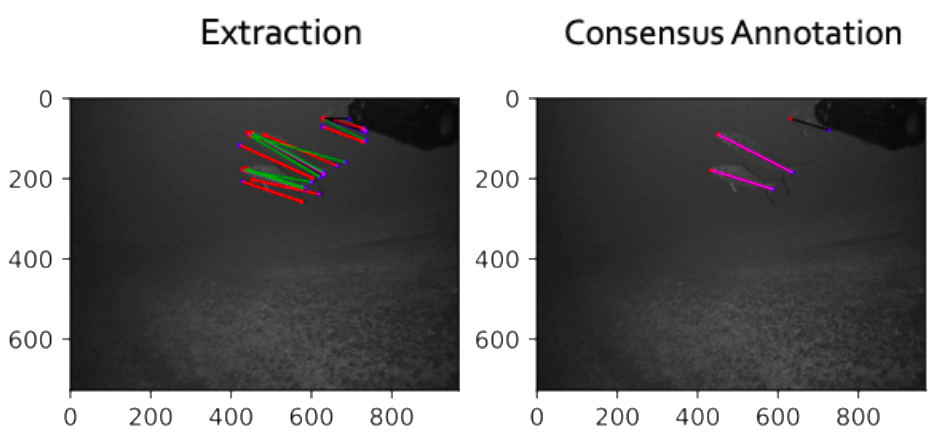
Figure 1. Example of visualization of location and species IDs from each of the individual annotations (left) as well as from the resulting “consensus” annotation (right).
Detecting Fish
Methodology
Our first question was simply: “Can volunteers see the fish in the images?”. This is also known as presence/absence data. The two main pieces of information we wanted to know were:
- Do volunteers say that images contain no fish when there are actually fish present somewhere in the image? (Also known as false negative)
- Do volunteers say that there are fish in images that actually contain no fish? (also known as false positive (this might occur if someone thinks something is a fish when it is actually a rock, piece of floating matter, shadow, etc.))
For false negatives, we counted the number of times the consensus annotation for a particular image showed zero fish when our researchers did see fish. For false positives, we counted the number of times the consensus annotation for a particular image showed greater than zero fish images where our researchers were not able to see any fish.
Results
Scoring your results against those from our researchers yielded a total false positive percentage of 0% and a false negative percentage of 3%. This shows that citizen scientists do occasionally miss fish in the images but rarely “add” fish that aren't there. This makes sense as our researchers benefit from the ability to watch the entire video as opposed to just still frames, and are therefore better able to detect motion. We are currently working on a new feature that will soon allow you to toggle between two sequential images, hopefully allowing you to detect motion in much the same way as our researchers! Overall, your presence/absence accuracy was 97%, which is very impressive. Well done!
Counting Fish
Methodology
The second main question takes Question 1 a little bit further by addressing not just whether you saw fish or not, but how many fish were you able to count (also known as “How many fish are in the image?”). For this question, we were interested in:
- How many consensus annotations resulted in an overcount of fish?
- How many consensus annotations resulted in an undercount of fish?
We assessed overcounting and undercounting by comparing your annotations to ground truth expert annotations. We then summed the undercounts and overcounts to produce a total proportion of images for which your annotations and our annotations matched or were over/undercounts.
Results
The results show that there was one image in which fish were overcounted and 15 images in which fish were undercounted. This yielded an overall accuracy of 84% for count data. Again, well done! Much as with your presence/absence data, these results make sense given your inability to see motion. We’re working on that. We are happy to see that undercounting is more common than overcounting. Undercounting leads to a conservative estimate over overall population abundance, whereas overcounting would lead to an overestimation. Over-estimation of abundance could lead managers to recommend fishing quotas higher than what the population could sustain.
Locating Fish
Methodology
Our third question centers on whether volunteers can accurately mark the actual location of individual fish within an image. While the first two questions are important for deriving accurate population estimates, this third question is critical for training machine learning algorithms.
We divided location information into three different categories (Figure 2):
On position
- A line is correctly drawn along the length of the fish, with “head” and “tail” positions identified correctly
Opposite - A line is correctly drawn along the length of the fish, but “head” and “tail” positions are reversed (e.g., “head” is marked as “tail” and “tail” is marked as “head”)
Rogue - “Head” and/or “tail” coordinates are in incorrect positions (excluding “opposite” category). For example: markings were not placed on the fish
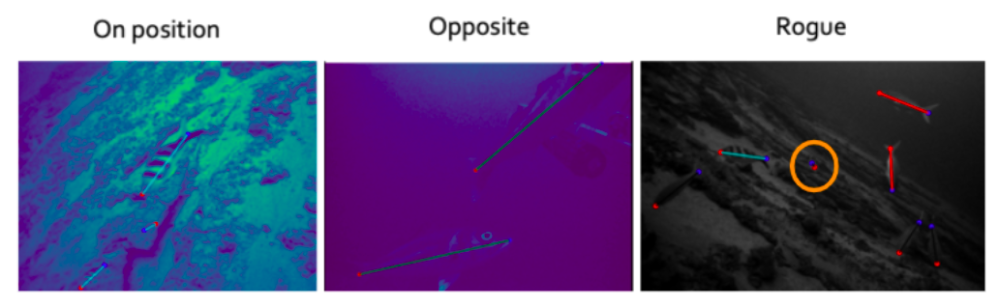
Figure 2. Location information included “on position” points (left), “opposite” points (middle image), and “rogue” points (right image, circled in orange). Red points represent “head” position and blue points represent “tail” position.
We visually evaluated the accuracy of the point placement, placing each of the points into one of the aforementioned point categories, and quantitatively evaluated the accuracy by finding the proportion of correctly positioned points over the total number of points throughout the images.
Results
Reviewing the consensus annotations, results showed that positional accuracy was around 89%.
Identifying Fish
Methodology
The final question of interest, and the most complicated, concerns species classification or identification. We needed to know how accurately volunteers, who had only received our minimal tutorial on species identification, could assign the proper species name to the fish that they saw.
To evaluate this, we compared the consensus annotation species ID to our ground truth expert annotations. We then created a confusion matrix (see Table 1) that allowed us to see the number of individuals of each species that were correctly and incorrectly identified. This matrix also allowed us to see, for those individuals that were misidentified, what they were most commonly miss-classified as. For example, of 41 lehi, 30 were correctly identified, 1 was misidentified as an ehu, 1 was misidentified as an opakapaka, and 9 were misidentified as other. It also allowed us to find the ratio of correctly classified species.
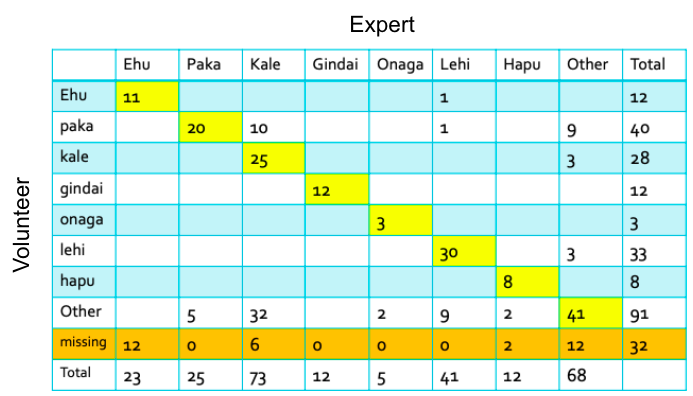
Table 1. Confusion matrix summarizing results of fish species identification portion of beta test. “Volunteer” rows correspond to the species identifications made by users during the beta test and the “Expert” columns correspond to the species identifications from the ground truth expert annotations.
Results
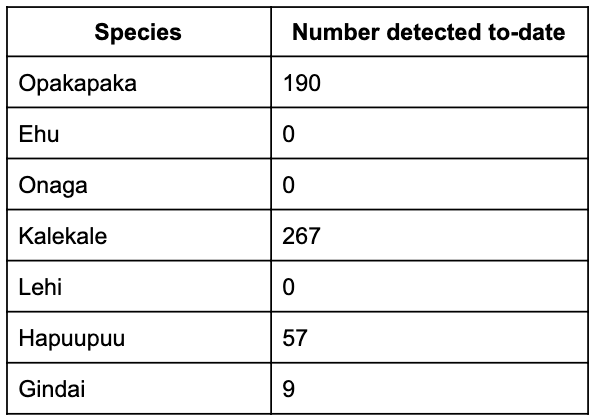
The accuracy for species ID ranged from a low of 37% for Kalekale and a high of 100% for Ehu and Gindai, resulting in an average accuracy of 75.4% (see Table 2).
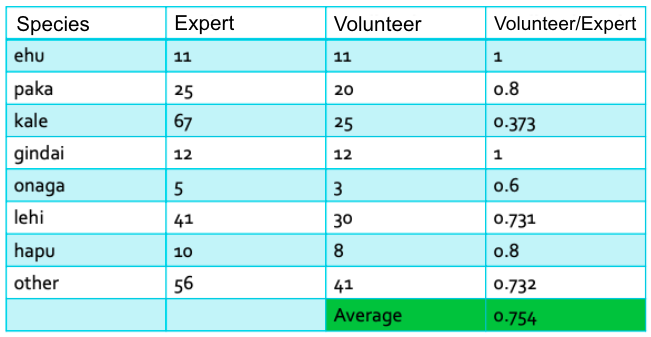
Table 2. This is a table showing the proportion of correctly identified fish per Deep 7 species. The accuracy ranges from a low of 37% for Kalekale to a high of 1 for Ehu and Gindai, resulting in an average accuracy of 75.4%.
Overall Beta Test Results
Overall, results from the beta test show that citizen scientist volunteers like yourself were able to achieve 97% accuracy for presence/absence data, 84% accuracy for count data, 89% accuracy for positional data, and 75% accuracy for species ID data. This averages to around an 86% accuracy and with project adjustments from errors we learned during the beta trial, we hope the accuracy levels will increase even more.
These preliminary results suggest that citizen scientists can effectively produce high quality data that benefits both the scientific community and the general public. We thank you so much for taking the time to participate in our project!