


Finished! Looks like this project is out of data at the moment!
Results
How Important are the Edges of Ecosystems? A Study of Large Mammal Community Along Edges in the Forest-Savannah Mosaic of Lopé National Park (LNP), Gabon
NB: An excerpt of the results from this study is presented below. Unfortunately, we are unable to provide detailed information on the methodology. However, we are currently working towards publishing our results in an open-access peer-reviewed journal which will contain details about our work. We will update you when this is published. Meanwhile, if you have specific questions, please send an email to cae37@cam.ac.uk.
We investigated the population size and activity patterns of 5 large mammals at forest edges in the LNP. These mammals are the western lowland gorilla (Gorilla gorilla gorilla), central chimpanzee (Pan troglodytes troglodytes), African buffalo (Syncerus caffer), red river hog (Potamochoerus porcus) and leopard (Panthera pardus).
The specific research questions we sought to answer are;
- Which large mammal species occur around the forest edge of LNP?
- a) At what density (animals per km2) do some of the largest of these mammals (in Q1) occur around the forest edge?
b) How does this density fluctuate throughout the year/between seasons?
c) What is the biomass of some of these mammals around the forest edge? - How do the selected large mammals use the edge of the forest in the landscape?
- To what extent can the public be integrated into conservation research?
Research Question 1: Which large mammal species occur around the forest edge of LNP?
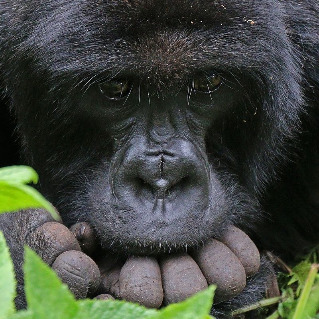
A total of 18 large mammal species belonging to 4 mammalian orders (Carnivora, Cetartiodactyla, Primates and Proboscidea) were recorded around the forest edges of the study area (see Table 1). According to the International Union for the Conservation of Nature (IUCN), 6 of these species are currently threatened with extinction (i.e. either listed as Vulnerable, Endangered or Critically Endangered) while the others are at a lower risk. Figure 1 contains camera trap photographs of selected species belonging to each of the mammalian orders
Table 1: Large mammal species richness around the forest edges of the LNP.


Figure 1: Camera trap photos of selected species from each mammalian order recorded.
Research Question 2: a). At what density (animals per km2) do some of the largest of these mammals (in Q1) occur around the forest edge? b). How does this density fluctuate throughout the year/between seasons? and c). What is the biomass of some of these mammals around the forest edge?
The mean annual densities of the species of interest are presented in Table 2 and Figures 2 - 6 (The shaded area in these figures represents the standard error of the monthly means). The estimated densities of all the mammals were less than 1. The African buffalo had the highest density (0.72 per km2), while the Central chimpanzee had the lowest (0.08 per km2). However, all five species were recorded at least once per month in all 40 transects, confirming their presence across the edges of the LNP. Table 2 also shows a fluctuation in the seasonal density between species. The density of buffalos, gorillas and red river hogs were higher in the wet season than in the dry season. Meanwhile, the reverse was the case for chimpanzees and leopards. However, the ANOVA test of difference showed no significant difference between seasons for all species (Table 2). The biomasses of the selected mammals are presented in Table 3.
Table 2: Densities of the selected large mammal species. n.s - no significant difference


Table 3: Estimates of biomass densities of selected mammal species. Biomasses are listed in descending order. *The biomass density of forest elephant was calculated using a density estimate (3.1 ± 0.2) provided by Cardoso et al. (2019).

Research Question 3: How do the selected large mammals use the edge of the forest in the landscape?
An indication of the behaviour of selected species in the forest edge is shown in Table 4. The Table contains the percentages of each of the activities observed for the five mammal species studied.
Table 4: Behaviors of selected large mammal (count per activity is shown in brackets).

Since the total number of aggregated images for each species differs significantly (highest; African buffalo with 56,576 and lowest; central chimpanzee with 395), the count of each activity (in brackets) paints a clearer picture of species behaviour. Thus, a comparison of the percentages of the activities of large mammals along the forest edge is illustrated in Figure 7.
The most recorded behavior for the 5 selected species was ‘standing’ (35.6%) followed by ‘feeding’ (32.5%) (Table 6). The least recorded behaviours were ‘fighting’ (0.1%) and ‘mating’ (0.1%), although ‘mating’ had a higher count than ‘fighting’. Species in the Cetartiodactyla order had the highest feeding behaviour (African buffalo and red river hog), whereas no marked difference in the feeding behaviour of the Primates (chimpanzee and gorilla) and the Carnivora species (leopard) was observed (Figure 7).

Figure 7: Total behavior percentages of the selected large mammal species.
Research Question 4: To what extent can the public be integrated into conservation research?
The survey was taken by 262 volunteers. However, only 65% of the volunteers answered the second question. Out of the 262 volunteers that took the survey, 19.2% of them submitted that they have a professional affiliation with biodiversity conservation or environmental science, 76.3% reported that they have no affiliation, while 4.5% were unsure.
Twenty-two independent themes were identified in the open-ended question which sought to assess the perception and thoughts of volunteers on the integration of citizen science as a conservation tool (Figure 8). With over 50 responses, the most recorded submission was the uniqueness of the citizen science concept (Theme: great idea and useful concept). Volunteers also acknowledged the potentials of citizen science in raising awareness on the status and threats to biodiversity (Theme: Increases conservation awareness and engagement). Although this study did not measure awareness for Wild Gabon, this response (Theme: Increases conservation awareness and engagement) must have been as a result of the increased awareness of species and the threats to species due to their participation in conservation-related citizen science projects. Other critical points they highlighted include ‘Increases conservation effort’, ‘Increases capacity’ and ‘Fosters connectedness to nature’. Themes highlighting volunteer responsiveness to citizen science projects included ‘Fun’ and ‘People like it’. Some volunteers also highlighted some of the features of citizen science which are beneficial to the researcher. They were coded under the themes: ‘Cost-effectiveness’, ‘Time effective tool’, ‘Large studies suitability’ and ‘Global reach and connectivity’.

Figure 8: Identified themes in volunteer’s responses and their corresponding count.
To further simplify volunteer responses to this question, a word frequency analysis (Figure 9) was conducted to display the 100 most frequently used word. Conducted using Nvivo (QSR International Pty Ltd, 2018), the minimum word length was set to 3 and generic words such as ‘one’, ‘way’, ‘the’, and ‘can’ were manually removed. ‘Research’, ‘great’, ‘important’, ‘involve’, ‘like’ were the most frequently used words by volunteers. These words were used at least 20 times each.

Figure 9: Word cloud of the 100 most frequently used words by volunteers.
We hope you found these findings interesting! We intend to understand biomass and density of all the large mammal species along the forest edges of the LNP and thus require your effort to classify the remaining photos! Thanks in advance for your time.