


Finished! Looks like this project is out of data at the moment!
FAQ
Send us your questions through the TALK network! We'll pick the most frequently asked ones and answer them here.
Background information on the project and the classification tasks
What are the figures I see?
The Classification figures you see show data taken by NASA's TESS mission and generally look like this:

Each figure has three panels (labeled 1, 2, and 3) that highlight various features of a particular eclipsing binary candidate, as detected and preliminary analyzed by algorithms. Let us take a closer look at each panel.
Upper panels: the lightcurve
The upper panel (label 1) of each figure shows the brightness of a particular target star as a function of time (the lightcurve), such that the observed time is on the horizontal axis (in units of days) and the measured brightness of the star is on the vertical axis (in normalized units). The deeper dips in brightness (ideally highlighted by the green vertical bands) represent the periodic primary eclipses. If present, the shallower dips in brightness represent the secondary eclipses.
The vertical green bands show where a period-searching algorithm we used thinks the eclipses are. Ideally, the green vertical bands should coincide with the eclipses, but as you will see sometimes there may be a mismatch due to noisy data.
Here is a close-up of the upper panel shown above:

Lower left panels: the "phase-folded" lightcurve
The lower panel (label 2) of each figure shows the same data as the upper panel, but "phase-folded" on the EB period measured by the algorithm.
The orbital period is the amount of time that an object takes to complete one full orbit around the other object. It is indicated by phases 0 (start of the period), 1 (end of one period, when the full orbit around the target star is complete), 2 (end of two periods, when two full orbits around the target star are complete), etc.
Phase-folding is simply cutting the entire lightcurve into equal-length segments and stacking all segments on top of each other. The length of each segment is one period long, i.e. the distance between two consecutive green bands in the upper panel. The horizontal axis of the lower left panel shows the orbital phase of the lightcurve which, for one orbital period, runs from phase = 0 (start of one period) to phase = 1 (end of the period). Mathematically, phase = time divided by period.
Here, the phase is extended from -0.4 to 1.6 to cover two orbital periods so that we can see the general pattern of the lightcurve. As a result, the primary eclipses repeat at phases 0 and 1. If present, the secondary eclipses also repeat at their respective phase, e.g. 0.5 and 1.5.
The lower left panels generally look like this:

Here, the measured Eclipsing Binary period is correct and all the primary eclipses (deeper dips) fold at phases 0 and 1 (more explanation on Orbital Phases below). For this particular target, there are also secondary eclipses (shallower dips) that also fold near phases 0.5 and 1.5. Note that, in general, the secondary eclipses can be at any phase other than 0 and 1.
As part of the classification process, we will confirm whether the model from the TESS data (upper panels) is correctly predicting the primary eclipses at phase 0 and 1 (lower left panels), and, if present, if there are secondary eclipses somewhere in between phases 0 and 1.
Lower right panels: the TESS images
The objective of having this image is a double check that we are looking at the right target, and as an additional check that the TESS measurements for the target in question are reliable.
The lower right panel of each plot (label 3) shows a "postage stamp" 11x11 pixels TESS image centered near the target star (represented with a red star symbol). These "postage stamps" are used to find the pixel location of the source of the eclipses (represented with a black open circle). For context, each TESS pixel covers about 400 square arcseconds of the sky. The pixels are tiny -- for reference, the entire sky covers about 535 billion arcseconds!
The lower right panels generally look like this:

Ideally, the lower right panels will show a single, well-defined (pixelated) bright "spot" located near the middle of the image and spread over several pixels. This is what you should look for in the classifications. Disregard the dots, stars and circles!
That will not always be the case, however, as there are many potential false positives and unreliable measurements in the dataset. With your help, we can sieve through those!
What are the science objectives of the project?
The main science objective of EB Patrol is to create a uniformly-vetted and uniformly-validated all-sky catalog of EBs observed by TESS. In turn, this would provide better understanding of the formation, orbital and physical properties, and evolution of close binary stars found in various Galactic environments, stellar populations, and at various evolutionary stages.
FAQ: Classifying images for Eclipsing Binary Patrol
Sometimes, it looks like the measured period is too long or too short by a factor of 2, 3, etc. Why is that?
This happens when the algorithm is incorrectly counting the primary eclipses. In such cases, the lower left panels might show "secondary" eclipses between phases 0 and 1 that are identical to the primary eclipses, or even deeper. This would indicate that the measured period is off by an integer factor from the correct period, i.e. 1/3, 1/2, 2, 3, etc. When scrutinizing an eclipsing binary candidate for this issue, take a closer look at both the upper and the lower left panels. Let's take a look at how this might show up during classifications.
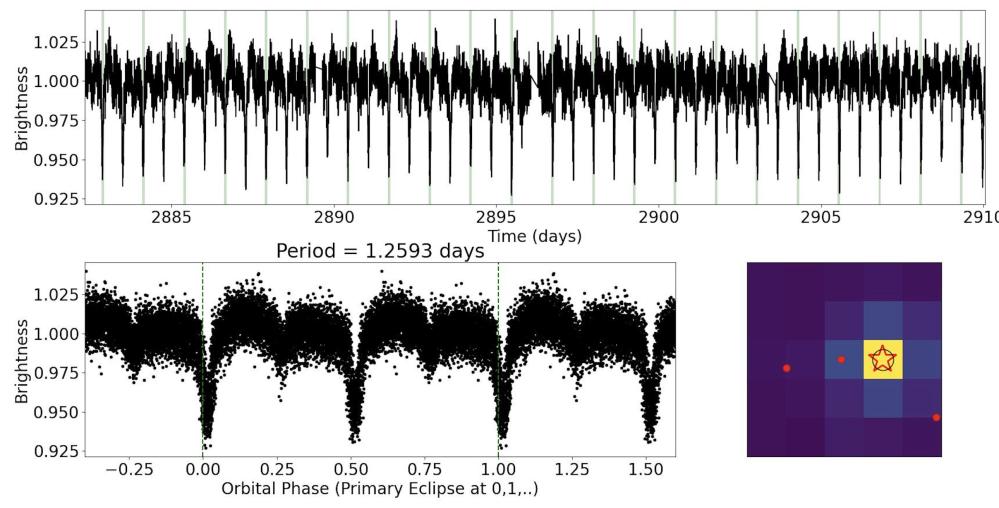
Here is an example Eclipsing Binary candidate where the algorithm counted every other primary eclipse (see the green vertical bands in the upper panel). The strong modulations in the lightcurve tricked the algorithm in missing the primary eclipses at phases 0.5 and 1.5! As a result, the measured period (1.26 days) is a factor of 2 too long -- the true period is 0.63 days:
Here is an example where it just so happens that a primary eclipse falls into a data gap and the algorithm counts the first and the third primary eclipses. Thankfully, we see the consecutive secondary eclipses that immediately show that the true period is half of the measured period:

Here is another example, where the algorithm counted every primary and every secondary eclipse (instead of just the primary eclipses) and decided that the period is about 2.2 days. Visual inspection quickly identifies the "off-by-two" issue and shows that the measured period is a factor of 2 too short -- the true period is about 4.4 days.

Note that while a factor of two may be the most common, there might be cases where the factor is higher (3, 4, etc). Here is an example of a measured period that is a factor of three too long:

Why do some of the lower right panels look odd?
Sometimes, the lower right panels do not show a single, well-defined (pixelated) bright "spot" located near the middle of the image and spread over several pixels:

Such images are caused by strong systematic effects ("noise") that make the measured pixel position of the eclipses (sometimes referred to as the "center of light", or "photocenter") unreliable. Here, "noise" is referred to as any apparent signal in the data that is not astrophysical in nature.
In cases like these, the measurements will have to be carefully redone -- if possible at all. If you see such images, you can discuss them on Talk Boards with a hashtag #noisyimage.
If I make a mistake, can I go back and change my answers?
You can edit your answers until you press the 'Done' or 'Done & Talk' button. However, once you submit your classification it goes straight into our database and you won't be able to change it. But don't worry! Each image is seen by multiple volunteers so any errors are smoothed out.
How do I know if I'm doing this right?
To quote the Planet Hunters TESS project, "Human beings are really good at pattern recognition, and generally your first answer is likely the right one". We encourage you to use your best judgement. Use the examples in the tutorial, field guide and Talk via the "need some help with this task" button.
Hashtags
A good option to streamline classification of objects is to use hashtags.
Check out the Field Guide and the Talk Boards for suggestions like #noise, #incorrectperiod when the model is not correctly predicting the eclipses at phases 0 and 1, #offtarget (the EB signal is coming from a nearby field star), or even #needsmoreeyes that might mean we could be looking at a multiple star or multiplanetary system -- or invent your own! Hashtags also enable a quick and easy way to search for particular subjects.
More information for those who want to learn more
What does TIC stand for?
"TIC" stands for TESS Input Catalog. The TIC catalog name looks like "TIC NNNNNNNNN". Once you have your star's TIC number, you can find images of the star and more details at the Mikulski Archive for Space Telescope (MAST). In the upper left of the page, you'll see the words "Select a collection...". Choose "MAST Catalogs" from the drop-down menu. Then use the "Mission:" drop down menu to navigate to "TESS Input v8". To the right, the screen says "and enter target:" Type the name of your star into that box as "TIC NNNNNNNNN" and click "Search".

Where can I find information about the star I am looking at?
Start by clicking on the "i" in a circle button that's underneath the image you classified, in the lower right corner. A pop-up will appear with a link that looks like this: "ExoFOP-TESS Link: https://exofop.ipac.caltech.edu/tess/target.php?id=177160057" Click on the link and it will take you to a page in the Exoplanet Follow-up Observing Program" (ExoFOP) catalog with lots of information about the target:

If you're eager to find even more information on this target, scroll down the ExoFOP page and look for the "External Links" on the lower left:

Click on those links to view information about your target in other catalogs: SIMBAD, MAST, Keck Observatory Archive, etc.
What is the Fast Lightcurve Inspector and how do I use it?
The Fast Lightcurve Inspector (FLI) is an online platform for interactive inspection and analysis of TESS data. It can be accessed on the 'i' button below each image.
It shows the full un-filtered lightcurve of the target star in question as observed by TESS and enables on-demand manipulation of the data, including phase-folding! For example, you can use FLI to confirm whether an interesting feature in a particular lightcurve can be attributed to an eclipsing binary star candidate. This can be especially useful in situations where the data is quite noisy, e.g. the lightcurve is highly variable or the eclipses are shallow.
Can't some of this work be done by a computer?
Yes! Most of the analysis aimed at identifying false positives in TESS data is done by computers. However, the results can sometimes be unreliable, especially when the number of detected eclipses is small, their signal-to-noise ratio is low due to e.g. instrumental and/or astrophysical artifacts, and/or systematic effects dominate the data.
As an example, here is a lightcurve showing periodic brightening events instead of eclipses (most likely due to systematic effects):

This is not unexpected. The search algorithm is sifting through hundreds of thousands of lightcurves and can sometimes get confused. Machines can make mistakes too -- - and this is (part of) the reason why we need your help!
Additionally, the computer measures the center-of-light of the images you see here (the lower right panels), regardless of their quality, and automatically compares it to the catalog position of the corresponding star. Note that the lower right panels are averaged over all detected eclipses. Evaluating the per-eclipse image quality is highly non-trivial as each target star has its unique data quirks, issues, and systematics, and sometimes the differences between a good image and a bad one are subtle. Human eyes excel at assessing those tougher cases!
Are there TESS-related Citizen Science projects specifically for exoplanets on Zooniverse?
Yes! You can check out the Planet Hunters TESS project, where you can sift through the TESS light curves and help identify new transiting exoplanet candidates.
How is Eclipsing Binary Patrol different from Planet Hunters TESS and Planet Patrol?
Here we are distinguishing between eclipsing binary candidates and impostors. With that said, some of our candidates may show additional events in their lightcurves that could suggest the presence of transiting planets!
In Planet Hunters TESS you can help search through the TESS database for interesting objects such as planet candidates or eclipsing binaries.
In our sister project Planet Patrol we scrutinized thousands of known transiting exoplanets candidates, and identified hundreds of false positives. You can find the catalog here.
Why do I sometimes see small red dots on some of the lower right panels?
The various symbols in the lower right panels are used by the science team for a deep-dive analysis of the data. You can ignore them when classifying the images. If you are curious about their meaning, below is a brief outline.
The red dots represent stars that happen to be near the TESS target star as projected on the sky (but not necessarily physically associated with the target star) and are bright enough to produce the detected eclipses. The red dots tell us whether the target star is an Eclipsing Binary or an impostor.
Ideally, the red dots will be clearly separated from both the red star (the position of the target according to the Gaia catalog) and from the black circle (the measured position of the source of the eclipses). In this situation, the nearby stars corresponding to the red dots can be safely ruled out as potential false positives and the target star is confirmed as a genuine eclipsing binary. Here is an example of this:

In other cases, a red dot will be close to the black open circle -- and both will be clearly separated from the red star. In this scenario, the eclipsing binary is not the target star but the nearby star corresponding to that red dot! Here is an example of this:

Sometimes, the red star, the black circle, and a red dot will be very close to each other. Here is an example of this for the case of TIC 348842168:

On the left you can see the 5x5 pixels TESS image. On the right you can see a corresponding image from the Digitized Sky Survey (DSS) with the corresponding TESS pixels overlayed. As the DSS pixels are about 20 times smaller than those of TESS, the corresponding image resolution is much higher. You can interactively inspect the DSS image here.
The red dot on the TESS image represents a nearby field star (TIC 737405737) that is separated from the target star (TIC 348842168) by only 1.5 arcsec -- this is less than one tenth of a TESS pixel! On the DSS image, TIC 737405737 is the small yellow x symbol just above the small crosshair.
One of these two is the eclipsing binary and the other is an impostor. However, this is as far as we can go based on the TESS data alone for this particular target. A sky-projected separation of 1.5 arcsec is just too small for the algorithm to tell which one is which...You can mention targets like this in the Talk Boards with a hashtag #fscp ("Field Star in Central Pixel" that is bright enough to contaminate but too close to the target to be ruled out).
Want to do more with Eclipsing Binary Patrol?
Are you interested in learning more about eclipsing binaries and/or getting involved with the project beyond contributing classification? If so, you can send us your email through this Google Form and we will add you to our Advanced User group.
Think you've caught an interesting one?
Do you think you caught a multi star system with additional eclipses or transit-like events in-between the main eclipses? These can come in a wide variety of lightcurve configurations, shapes, patterns and features and are generally characterized by one or more "outliers" superimposed on the regular eclipse pattern. Here you can see a few examples of triple systems producing an eclipsing binary ("EB") as well as tertiary eclipses ("tert"):

For more examples, you can check out this paper and references therein.
You can tag such targets on Talk with a hashtag #needsmoreeyes. You can also fill this Google Form where we keep track of the potential candidates.