


Finished! Looks like this project is out of data at the moment!
We've finally run out of data, and together you've rescued 50 years of tide gauge data in just over one year. Thanks for all your help!
Research
Why rescue tide gauge data?
Coasts are home to approximately 28% of the global population, including around 11% living on land less than 10 m above sea level and people living in the coastal zone face exposure to change in the oceans (IPCC, 2019).
We need long sea level records to study climate change and sea level rise. In the global database of mean sea level data (PSMSL) the average length of a data series is 37 years. We need at least 60 years of data from a location to look at long-term changes.

One way we can extend the records we hold and fill in the gaps in the global dataset is to recover historical data. Long-term sea level data series are rare and the measurements unrepeatable. By helping us digitise the data held in these ledgers, you will extend the global sea level record.
The recovered data will also make a vital contribution to oceanography (ocean currents, tides, surges), geodesy (national datum), and geophysics and geology (coastal land movements).
Where did the images come from?

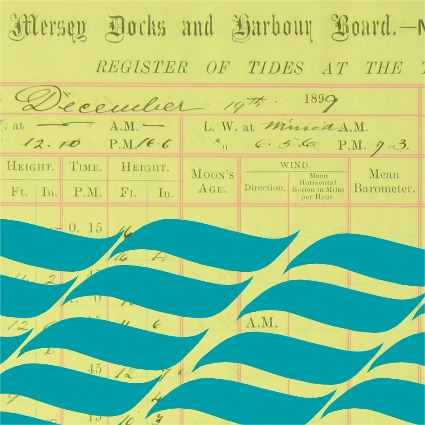
In 1993 the British Oceanographic Data Centre (BODC) acquired historic tide gauge registers from the Mersey Docks and Harbour Company (MDHC). These registers are in the form of large, leather‐bound volumes dating back to 1853 for Hilbre Island and 1857 for Georges Pier. There are approximately 200 ledgers. Some of the ledgers include metrological data alongside the tidal information.
The scanning of the ledgers was funded through the JISC Content programme 2011-13, Strand B: Mass Digitisation.
The main aim of the project was to improve access to historic tide gauge data in our archives and encourage reuse of the data. These analogue records have always been available to the general public, but not easily accessible. An enquirer would have to contact us to find out if we held any data of interest before arranging a visit to consult the resource. Making digital copies onsite was difficult, so the numbers were often recorded by hand.
Why were the measurements made at the time? (From Woodworth, 1999)
The gauge at George’s Pier was installed in 1853 and began operations in mid-January 1854. It made use of the floatation of the landing stage rather than of a conventional float in a stilling well, and provided one of the earliest long records in the UK of sea level variations throughout the complete tidal cycle. The gauge itself was a chart recorder manufactured by Newman driven by a “chain” to the landing stage. A similar system was installed at almost the same time at Hilbre Island, in the mouth of the estuary of the River Dee, using the same tide gauge hardware but with a conventional float arrangement. Sea level, measured relative to the ODS, was noted every 15 minutes and was recorded in red notebooks. From these records, values of annual mean sea level have been computed, along with mean tidal range and mean high waters for this analysis. However, the 15 minute values themselves spanning half a century remain uncomputerised.

Hilbre was evidently established as “open ocean” gauge by the MDHB, and also no doubt for surveying purposes along the Wirral coast. It is of historical instrumental interest with a siphon water conduit to the open sea.
What are we going to do with the data?
The main aim of extending sea level records is to include them in the Permanent Service for Mean Sea Level (PSMSL) dataset, which is then used in the Intergovernmental Panel on Climate Change (IPCC) Assessment Reports. The sea level data set could be used in Meteorological reanalysis and also to constrain operational surge models.
High-frequency data (typically defined as a sampling interval of one hour or less) can used to study high-frequency variability, storm surges and the propagation of tsunamis. Tide gauge observations are used for coastal engineering and protection as well as to study coastal processes and changes in extreme sea levels and their return periods (Bradshaw et al., 2015).

The fact that the George’s Pier 15 minute values have not so far been computerised has hindered a complete tidal analysis of the data (Woodworth, 1999).
Even short sections of historic data can be very helpful in reconstructing historic sea-level, as records at one gauge can then be compared to others nearby. This process of "buddy checking" helps us tell the difference between changes in measurement systems, short term changes due to weather, and long term changes due to climate. Our colleagues at NOC and University of Liverpool explain more about the process in Hogarth, 2020.
References
Bradshaw, E. (2020, 03). Why rescue data? Paper presented at the Intergovernmental Oceanographic Commission of UNESCO’s Sea Level Data Archaeology Workshop, Paris. Abstract retrieved from https://unesdoc.unesco.org/ark:/48223/pf0000373327.
Bradshaw, E., Rickards, L., & Aarup, T. (2015). Sea level data archaeology and the global sea level observing system (GLOSS). GeoResJ, 6, 9-16. https://doi.org/10.1016/j.grj.2015.02.005
Hogarth, P., Hughes, C. W., Williams, S. D. P., & Wilson, C. (2020). Improved and extended tide gauge records for the British Isles leading to more consistent estimates of sea level rise and acceleration since 1958. Progress in Oceanography, 102333. https://doi.org/10.1016/j.pocean.2020.102333
IPCC, 2019: Technical Summary [H.-O. Pörtner, D.C. Roberts, V. Masson-Delmotte, P. Zhai, E. Poloczanska, K. Mintenbeck, M. Tignor, A. Alegría, M. Nicolai, A. Okem, J. Petzold, B. Rama, N.M. Weyer (eds.)]. In: IPCC Special Report on the Ocean and Cryosphere in a Changing Climate [H.- O. Pörtner, D.C. Roberts, V. Masson-Delmotte, P. Zhai, M. Tignor, E. Poloczanska, K. Mintenbeck, A. Alegría, M. Nicolai, A. Okem, J. Petzold, B. Rama, N.M. Weyer (eds.)]. In press.
Lord, W. (1855). On the results of the self-registering tide gauge. Transactions of the Lancashire and Cheshire Historic Society, 7, 235-237.
Woodworth, P. L. (1999). A study of changes in high water levels and tides at Liverpool during the last two hundred and thirty years with some historical background. Proudman Oceanographic Laboratory Report No. 56.