


Welcome to all our new volunteers (and hello to our regulars)! Join us in the talkboard if you have any questions or interesting sightings. Happy counting 🐟
Research
Aotearoa's marine environment
Aotearoa New Zealand is an island nation emerging from the seas of a vast underwater continent. Our history and identity are intrinsically connected to the ocean, all the way back to the voyagers who navigated thousands of miles across Te Moana-nui-a-Kiwa, the South Pacific, and made Aotearoa their new homeland as tangata whenua (Māori, people of the land).
Marine biodiversity
Our seas are home to over 17,000 species – including 264 fish species which are found only here – and more continue to be discovered. Experts estimate that up to 85% of the wildlife of Aotearoa could be in the ocean. However, many of our marine ecosystems are under immense pressure from commercial and recreational fishing, pollution, dredging, and climate change.
Learn more about our marine biodiversity
Marine reserves
Marine reserves are one of the best tools we have to protect these ecosystems, by rebuilding populations and increasing their resilience for the future. We have 44 marine reserves across the country, encompassing habitats from kelp forests and rocky reefs to soft sediments and mangrove swamps.
Te Papa Atawhai/Department of Conservation (DOC) manages these reserves as the government agency tasked with conserving the natural heritage of Aotearoa. Within DOC, the Marine Ecosystems Team are scaling up marine reserve monitoring programmes through a new national framework, which will help us with research and management.
Map showing the locations of the marine reserves of Aotearoa.
Baited Underwater Video (BUV)
Our new marine monitoring program has many different research objectives, including evaluating habitat composition, water quality, and indicators of climate change. One of these research objectives is to study the abundance (population numbers) and demography (characteristics such as size) of key species, which is where baited underwater video surveys enter the scene.
BUV is a simple, versatile underwater survey method that DOC uses to compare the abundance of carnivorous and scavenger fishes inside and outside marine reserves. Other species are monitored with different methods.
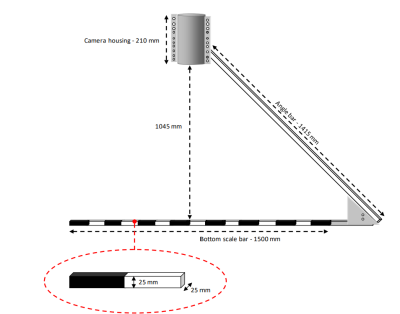
The setup involves a triangular metal frame with a camera pointing downwards to a bait box. The frame is lowered off the side of the boat, where it settles onto the rocky reef or seabed. Small underwater floats keep the frame upright, and a rope attached to a surface buoy ensures the frame and camera can be retrieved. After the camera has been filming for thirty minutes, we haul it back up to the surface and deploy it again in a different location.
BUV differs to other survey methods, such as SCUBA diving, because some fish avoid divers while others are attracted to them. BUV can also collect data a lot deeper than divers can, and isn’t as affected by water visibility. On a clear day, divers can spot fish much further away than on a murky day, which increases the number of fish counted. With BUV, as long as it’s possible to see the seabed and identify the species, water visibility doesn’t greatly affect the number of fish counted.
The research
Studying the abundance and demography of key species in order to understand their response to marine protection
- Abundance = how many individuals of a species are present
- Demography = characteristics of a population, specifically, how individuals are spread across different size ‘classes’ (i.e. are there many small fish and only a few big fish in this population?)
Your classifications will be analysed and used for regular research reports on the state and effectiveness of each marine reserve, including short report cards which summarise the health of the reserve over time. This will inform management by showing us which reserves are most effective for which species and why, and providing evidence to justify continued marine protection.
View marine reserve report cards here
Our two main research questions are:
1. Do marine reserves change the population numbers of key species?
This is a spatial research question – comparing across space. Here, we investigate the differences in population sizes between reserves and nearby places without protection. We can answer this research question immediately after analysing the data, even if it is the first survey conducted in a particular reserve.
2. Do marine reserves change the population numbers of key species over time?
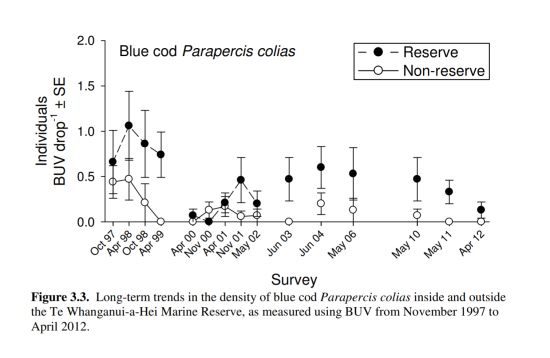
This is a spatio-temporal research question, comparing across both space and time. Here, we investigate the change in population sizes over time. Though some reserves have had extremely quick population recoveries (snapper at the Poor Knights rebuilt their population within three years of the marine reserve being established), it is likely that we will only detect real trends after five years of protection. Many marine reserves are already well past this anniversary, so we can compare this new research to historical data.
What are key species?
Our research questions are full of this term! There are two main types of key species:
- ecological keystone species, which have a crucial role in maintaining the structure of a community or ecosystem, and
- cultural keystone species, which shape the cultural identity of a people.
Some species are both, like snapper. Snapper prey on kina, the endemic sea urchin of Aotearoa. Kina are kelp grazers, and if their numbers get out of control then they can completely obliterate kelp beds, forming ‘kina barrens’. However, when snapper numbers increase, they eat the kina, reducing their population numbers so that the kelp beds recover. This transforms the ecosystem and greatly increases its biodiversity, as kelp beds provide a habitat for many different species. Snapper are therefore an ecological keystone species. They are also a taonga species (a species of particular cultural significance) for many Māori, and one of the most common species fished recreationally, which makes them a cultural keystone species as well.
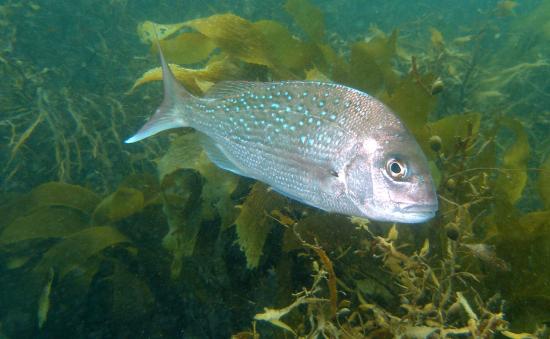
An adult snapper (Chrysophrys auratus) swimming over kelp.
Image: Brian Mackie
How we answer the research questions
Abundance and demography of common and widespread species
As describing the abundance and demography of key species is literally our main research goal, it makes a lot of sense for this to be something we measure! From BUV data, we can measure:
- Density = how many of a species are in a given space
- Relative abundance = how rare or abundant a species is compared to other species in the ecosystem (useful for understanding if the composition of a community is changing over time)
- Size = the length in cm from tip of the nose to the tail (total length)
Exploited species production
The most valued species for commercial and recreational fishing are often the first to show signs of recovery when fishing pressure is removed. Estimating the biomass (total weight of all individuals in a population, which considers both abundance and size) and productivity (how many offspring are being produced) of these exploited species is a good indicator that the reserve is effective. Snapper, blue cod, and rock lobster are examples of commonly harvested stocks.
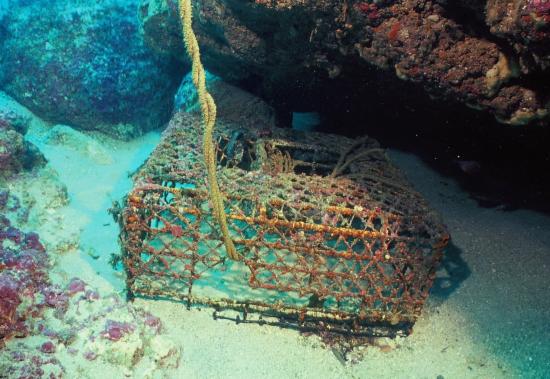
An abandoned lobster pot.
© Dr Kim Westerkov
Other research areas
Incidental data
This is data that is obtained as a by-product of the main research goals, and it can be used to investigate all sorts of interesting research questions. The video footage from BUV contains a huge amount of information.
Your classifications help researchers interested in specific species quickly find the timestamps in the videos where they appear. For example, the University of Otago has used a BUV survey intended for general marine reserve monitoring to investigate broadnose sevengill sharks in Fiordland.
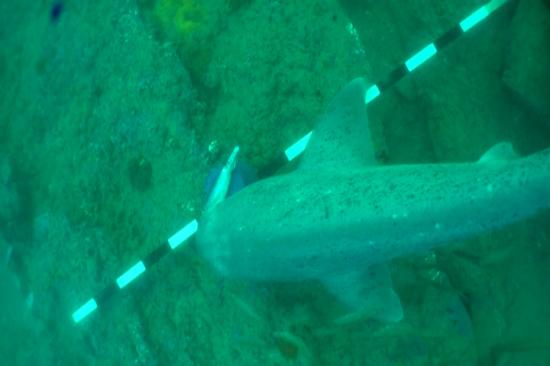
A sevengill shark (Notorynchus cepedianus) swimming over a BUV size marker and bait box.
Artificial intelligence for marine monitoring
As our data collection scales up, data analysis needs to scale up to match. It takes many days to analyse footage from one site, let alone footage from sites all over the country. However, breakthroughs in artificial intelligence and machine learning mean this no longer has to be the case.
We have partnered with worldwide machine learning experts to use your classifications to train machine learning models. At first, these models will help us filter out videos with no fish or other animals. Eventually, these models may be able to distinguish between a moving fish and kelp fronds waving in the current, spot an eel in the shadow of a rock, and use patterns and shapes to identify species.
This human-machine combination will free up a huge amount of time and resources, which can then be directed into new research and more efficient conservation actions to protect the biodiversity of Aotearoa for generations to come.
An example of an artificial intelligence algorithm recognising a cold water coral in another project Wildlife.ai worked on, the Koster seafloor observatory - we will apply this to fish and other critters in our marine reserves.