


Research
WHAT ARE SONIFICATIONS?
All sciences are by nature highly visual. In Maths, Physics, Biology, right from primary education, we are taught to plot graphs to represent information. This approach is undoubtedly effective but excludes the possibility to use our natural capabilities to their full extent. Naturally, one question arises: is it possible to do research using different sensory abilities?
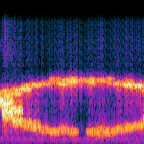
In this project, we explore communication using sound, using a data display method called sonification.
Sonification is the process of converting numerical data – such as the incoming light from a star, the transit of an exoplanet, etc. – into sounds, effectively replacing a visual graph with an auditory chart that conveys the same information.
These sounds are not already existing in nature, they are a construct used for communication only, just like visual representation but using a different sense.
WHY USE SOUND?
There are several factors that make sound a worthy opponent for traditional data display methods:
-
Distinguish particular streams in complex waves
Think about being on a busy street in a big city. It is very crowded, therefore you are subject to a variety of different sounds coming from anywhere around you. Despite the huge amount of information you can decide to listen to all of these sounds together or focus on the drilling from the construction site across the street, on the businessman talking on the phone about the stock market, or even on the lazy buzzing of a bee in the flower shop you are about to walk into.
The ability to isolate particular streams in complex soundwaves is a unique characteristic of this sense, which can be very useful in science to discern hidden patterns in traditionally visually crowded datasets. -
Sensitivity to rapid changes
Sound is much more suitable to detect rapid information variations than sight. In fact, where sight can detect changes lasting milliseconds, our auditory system can detect them even if they are only a few microseconds long. This means that when highly variable information is being displayed, it is possible to hear information that cannot be processed by our eyes. -
A wider field of perception
Our eyes are limited in their field of perception, allowing us to process information from an area around 190 degrees wide. Our ears, however, do not have that restriction. They are able to perceive information from anywhere as long as the sound source is not too far away from the listener. Future sonifications could take full advantage of this by creating 3D sound charts, which provide information about the position and direction of the data points considered. -
Effects on memory
It has been shown that the use of images and sounds simultaneously has a positive effect on memory. Using both data displays can help us understand information better and retain them for a longer period of time. -
Inclusivity
Finally, the most important reason for exploring alternative ways of displaying information and doing data analysis is inclusivity. All sciences represent data using traditional visualization tools, making it extremely challenging for visually impaired individuals to approach research. Using audio can open the doors to a world of opportunities through which to cultivate their interests.
WHAT TARGETS WERE SONIFIED?
For this project, we turned into sound charts a sample of different astronomical events from a variety of different imaging systems. These are:
- Lightcurves of exoplanetary transits and RR Lyrae from KEPLER SPACE TELESCOPE.
- Gamma-Ray events of various origins from FERMI LAT (Large-area telescope).
- Muon Rings and non-muon events from VERITAS(Very Energetic Radiation Imaging Telescope Array System). The muon events used in this work are part of the MUON HUNTER project by the VERITAS collaboration here on Zooniverse:(https://www.zooniverse.org/projects/zooniverse/muon-hunter-classic).
Lightcurves are graphs representing the incoming flux (the light - energy - produced by the object which reaches the surface of the detector per unit time) as a function of time.
Depending on the type of event, the light curves present characteristic behaviors, which allows researchers to understand what is being observed.
Lightcurves from three different events have been used in this work:
-
EXOPLANETARY TRANSITS - when a planet outside of our solar system passes in front of its host star, it blocks part of its incoming light, resulting in a periodic dimming of its flux.

Image credits: NASA
The transit will appear as a series of drops in its light curve, like in the picture shown below. This is the light curve of the exoplanet Kepler 19b, an Earth-like planet located in the constellation of Lyra.

- RR LYRAE VARIABLE - These are pulsating variable stars, whose radius changes periodically over a relatively short period of time. As the star shrinks its surface temperature rises causing its luminosity (their absolute, intrinsic brightness) to increase. This period-luminosity relationship makes them really useful to measure cosmic distances.

- GAMMA RAYS - Some events in our universe produce extremely energetic radiation. These high-frequency emissions are known as gamma rays. The events here considered are:
- Pulsars: rotating neutron stars (remnants of the collapse of a star) which are highly magnetic and emit beams of radiation at their poles.
- Active Galactic Nuclei (AGN): supermassive black holes at the center of a galaxy that accrete matter to produce jets of high-speed particles and radiation. Examples of AGN considered in this work are Blazars and Quasars, which are the names given to these active galactic nuclei depending on the orientation of the jet with respect to the observer on Earth. A sub-class of Blazars, BL Lacertae (LAC) objects was also considered in this study. These are characterized by a lack of emission lines in the optical spectrum.
- Gamma-Ray events of unknown origin: These are lightcurves from highly energetic events which still lack classification.
As shown in the pictures below, the light curves of these types of events are highly variable and lack a defined pattern like the objects shown above.

Finally, the last targets of interest are muon rings. Sometimes, high-energy particles reach the Earth's atmosphere in the form of cosmic ray showers. Some of these incoming particles move faster than the speed of light in that medium. Their emission, therefore, accumulates behind them as the particles overtake it. This radiation, called Cherenkov radiation, shows itself as a blue glow, which can be detected by the VERITAS imaging system.

Some of the byproducts of these cosmic showers are muons, elementary particles similar to electrons but much heavier. These can be recognized by their characteristic ring shape.
As they present a radius-signal relationship, they can be very useful to calibrate the telescope.
Light from muonic events, however, is not always perfectly aligned with the detector. Depending on the angle of incidence and the offset with respect to the centerline of the detector, a muon ring can appear partial or truncated, as shown in the picture below. Finally, some events which are not of muonic origin could be recorded as well.
This work takes into account all different types of events, whose information we aim to convey using sound only.
For more information please visit the MUON HUNTER project: https://www.zooniverse.org/projects/zooniverse/muon-hunter-classic/about/research
