


Finished! Looks like this project is out of data at the moment!
We're happy to announce that our preprint is out, describing our tree mapping research and the (now public) dataset that this project uses! You can find it on arXiv here and check out the models for yourself here. Thanks again for volunteering, your efforts are helping us improve our labels and ultimately improve the state of tree and restoration monitoring.
We've completed the classification stage for this project! To browse other active projects that still need your classifications, check out zooniverse.org/projects.
Results
The first batch is complete!
Incredible thanks to the over 3000 volunteers who helped tag our first batch of images in just a couple of months. We're checking the stats, but we think we have over 1.5 million tags!
What happens next?
- We will reach out to everyone who participated very shortly to share some preliminary results, if you have opted in to communications from Zooniverse then you should receive a newsletter from us.
- This batch of imagery covered around 20% of our tree crown dataset, plus some additional imagery from Justdiggit in TanzaniaW
- We've uploaded more images, taking into account feedback from the first campaign, for example one common request was adding a scale indicator to images. We're working on more field examples.
- We set a fairly high retirement count of 20 classifications, we'd like to explore if this was or wasn't enough to find "confident" tree labels. For example, we are interested to see how many labels we have that strongly agree with the Zooniverse community e.g. a label that 20/20 people indicated is a tree.
- We will share some results here; initially this will probably be some examples of labelled images so you can see what our data look like and some visual statistics we can create from our labels.
What your data looks like:
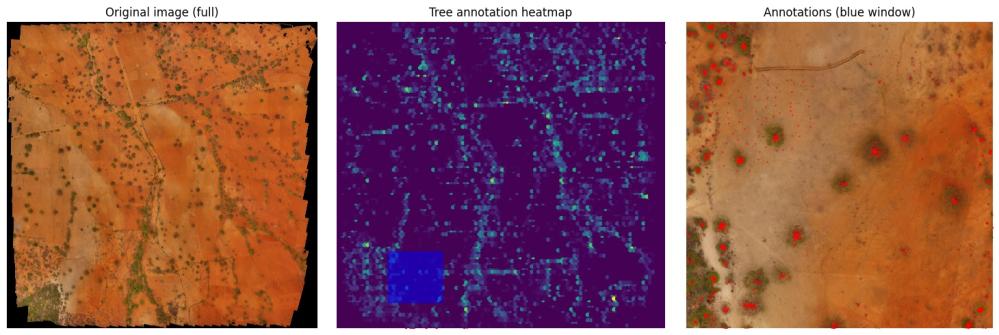
On the left is a full image that was split into around 1000 tiles before being uploaded to Zooniverse. The middle image shows the "tag density" - where citizen scientists most often clicked on trees. This image is reconstructed by aggregating the results from individual tiles and mapping them back to the original image. The right image shows a zoomed in region with individual tags in red. You can see that the tags follow the tree locations well, and (as expected) there is some variation in where people click, but it's mostly in the crown centre.
What we hope to gain from Zooniverse
- Your labels will be used to provide more confident "ground truth" against which we can test our model
- We will use the labels to validate our dataset and try to (automatically) identify previous annotations which were wrong or missing
- We can study how much humans agree on what a tree is in different environments. This is an interesting question because models trained on human-labelled data are only as good as their annotators. If we know what this level of agreement is, we can also estimate how well our models perform relative to humans, and what the best possible performance should be.
How does this help?
By improving our model we can provide more confident predictions of forest cover which will be useful to restoration practitioners, stakeholders and other ecology researchers.
I want to know more about how the annotations are used!
Ok. You might be wondering why we're asking you to label trees, and how your labels will help our research. On this page, we'll take a look at how we're using the labels that you've provided.
Over the last year, Restor has been developing a machine learning model to detect trees. That's a difficult task because - as you've not doubt seen from the data - the images are complex, it's not obvious what is or isn't a tree and there is a huge variety and diversity in the natural world. With support from Google.org, we were able to pay a team of annotators to label a large number of images. These annotations are polygons - individual trees are outlined, and we also requested annotations around groups of trees (as it's extremely time consuming and subjective to do this for dense forest). The model is given an image and a "mask" which describes where trees are, and its job is to try and predict that mask.
Labelling images in such a detailed way is time-consuming and expensive. Normally it's a good idea to get multiple annotators per image, and then perform some kind of aggregation to clean the labels. Some of our images are double-annotated in this way, and all were reviewed after labelling. We think the masks/outlines in our dataset are pretty good. Where we've identified some mistakes are where annotators labelled a single tree as multiple, or vice versa, or where grass/shrubs are labelled as tree canopy. This is where citizen science can help!
Rather than ask you to draw around all the trees again, we're simply asking you to mark their centres. We'll compare this to our existing annotations to see if they agree. For example, if we have a polygon that denotes a single tree, we would expect the community to also place a "single tree" label in the same region of the image. However, if we see that most people placed two points inside it, or a "group" point, then that label should be checked.
Similarly, once we have this additional database of crowd-sourced tree locations, we can verify that our model predicts trees where you've marked! And for each tree that the community labels, we will have some measure of confidence e.g. if 19/20 people said this label is a tree, then we can be very sure about it.
One large advantage of this is that we don't necessarily need marks for every tree in every image, so if you're not sure about a plant you don't need to label it. It's more important that we have a list of very confident labels, than a lot of unsure ones.
Over the next few weeks we'll do some analysis on the first batch of annotations and post the results here for you to see.
Results
We will publish results here when complete!