


Thanks a million (actually five and half million)!
The past eleven months have been wildly exciting! We never dreamed when we started out that we’d get such huge support for our project from the community of Zooniverse volunteers – 5.5 million classifications in all! At times it’s been a struggle processing results fast enough to maintain a supply of new snippets for classification. Once the final workflows are finished, we need to do some final processing before supplying data to the Office for National Statistics for release later in the year. We’ll do our best to publicise the release when we have further details.
Thanks again for all your support.
Research
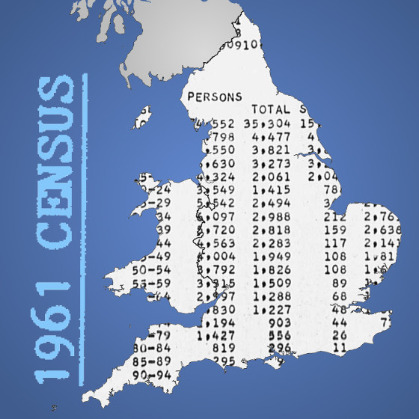
The 1961 UK Census is a uniquely valuable record of our society at a time of great social change in the UK. However, much of the 1961 Census data remains in microfilm format, which makes them inaccessible and useless for modern analyses.
This project aims to breathe new life into the data by retrieving and processing content from the Office for National Statistics 1961 Census Image Library. We want to make these data publicly available as a digital dataset, allowing people to use these data for their research.

Individual census records are confidential for 100 years, so we are not dealing with any census data that can identify an individual. We are dealing with data which has been aggregated to an area, for example the number of divorced males aged 30-34 living in Battersea.
We are processing 1961 English and Welsh data. These data have been digitised at different geographical areas, such as Districts, Wards and Enumeration Districts.
The image below shows a 1961 Census printout. It contains several tables which give information about a particular area, such as the number of households without hot water, or the number of people born in Cyprus.

We produced templates for all of these tables with regions for each cell. These allow us to “cookie cut” the values (persons, households, dwellings, rooms, establishments, etc.) into a data file.

As part of the template we assigned each variable a unique ID. Here you can see the template for one table (SH13 - Age and Marital Condition by Five Year Age Groups):

Using cutting edge OCR (Optical Character Recognition) techniques we have been able to extract around 97% of the values, but we need help with the remaining 3%, which the OCR either hasn’t recognised, or where we know there are errors due to discrepancies. This is why many of the values people check look fairly easy to interpret. This is where the Zooniverse site comes in. It’s a simple task, we are asking people to type what they see in the box (or most closely associated with the box):

You can see examples and further information in the tutorial, which can be found in the Classify section.
We are also undertaking work to compare values and identify inconsistencies:
- Comparing values within tables, e.g. ensuring that the “all people” value is the sum of all of the individual age bands
- Comparing identical values between tables, for example a value for “all females” will appear in numerous tables.
- Comparing values of a higher geography with the sum of all of the lower geographies (e.g. the values for Hammersmith, should be the sum of all of the Hammersmith wards). These checks allow us to identify any inconsistencies
This work helps us to target additional QA (Quality Assurance) work effectively, so we are only asking people to check what really needs to be checked.
What sort of topics do these data cover?
The 1961 tables that we’re processing include the following information:
- Tenure for households, persons, and rooms
- Building types
- Residents born outside of the UK (9 categories by Sex)
- Nationalities by sex (UK citizens, Other British, European nationalities, Other aliens)
- Non-private populations (excluding hotels) by sex and institution type
- Household by amenities (sharing / lacking: cold water; hot water; Fixed bath; WC)
- Pensioners living alone by Sex
- Pensioners living in two person households by sex
- Hotels by number of rooms (including number of staff, relatives of staff, resident guests, and resident visitors)
- Non-private households by age and sex
- Number of persons per room (by households, with kitchen, without exclusive use of stove and sink)
- Persons resident outside of the Local Authority area by sex
- Age and marital status by sex and five year age groups
- Single years of age by sex for under 21 year olds
- Households sharing a dwelling by the number of people
- Dwellings according to the number of household spaces and the number of rooms
- Private households by size, rooms occupied, sharing of dwellings
Take a look at the 1961 Census form to see how the questions were worded.
The original technology
In case you wondered, the 1961 data was processed using an IBM 705 computer owned by Royal Army Pay Corps. The original machine still exists and is on display at IBM UKs headquarters at Hursley Park, near Winchester

Who we are
We are a team based at the Pattern Recognition and Image Analysis (PRImA) research lab, University of Salford. We have received funding from the Office for National Statistics. We are all interested in data, and keen to make the 1961 Census aggregate data open to all. Take a look at the PRImA 1961 Census project page.
Why help?
You’ll be helping to bring the 1961 data back to life, which allows anyone to see the results easily. We will make the resulting dataset open access.
Our publications
- Creating a Complete Workflow for Digitising Historical Census Documents: Considerations and Evaluation
- Unearthing the Recent Past: Digitising and Understanding Statistical Information from Census Tables


