


Thanks a million (actually five and half million)!
The past eleven months have been wildly exciting! We never dreamed when we started out that we’d get such huge support for our project from the community of Zooniverse volunteers – 5.5 million classifications in all! At times it’s been a struggle processing results fast enough to maintain a supply of new snippets for classification. Once the final workflows are finished, we need to do some final processing before supplying data to the Office for National Statistics for release later in the year. We’ll do our best to publicise the release when we have further details.
Thanks again for all your support.
FAQ
What is the task?
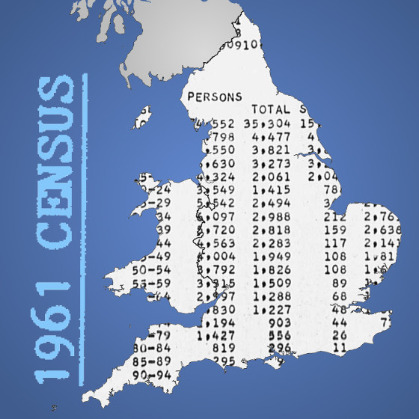
We are looking for you to simply type what you see. An image will appear, we want you to identify the number:
- The number we want you to identify will be within (or the number most closely associated) with a box
- We want your best guess, but if you can't give a best guess, then just leave the box blank (but please try!)
What if I can't decide which value is most closely associated with the blue box?

In some cases it can be difficult to decide which value in an image is most closely associated with the blue box. This is usually due to distortions introduced during the original capture of images to microfilm preventing the templates we use to locate and extract values relating to particular table cells from matching well with the underlying images. Please try to make a best guess if you can, or leave your entry empty/blank if you can't. Don't worry if you choose the wrong value, as all classifications are cycled back through our validation processes, and further rounds of classification in this Zooniverse project if necessary, until they 'fit' in the context of their neighbouring and equivalent values.
Analyses of empty classifications and persistent errors in results allow us to identify images with poor templating for special attention, which should reduce the proportion of 'hard to decide' snippets as the project progresses.
What if I get a value wrong?
Don't worry about getting values wrong, as all values undergo further validation processes, and can be fed back through Zooniverse, or be given special attention by the team until they are correct, and they 'fit' in the context of their neighbouring and equivalent values. Any guessed value has more chance of being correct than an empty entry.
Our validation processes include:
- Comparisons of equivalent sets of values within areas, e.g. ensuring that the “all people” value is the sum of all of the individual age bands
- Comparisons of identical values between tables, for example a value for “all females” will appear in numerous tables.
- Comparisons of values for higher geographies with sums of values for lower geographies (e.g. a value for a district should equal the sum of equivalent values for all of the constituent wards contained in the district).
- Checking for values that are statistical outliers (eg vaslues that indicate an unusually high or low proportion of a population in a particular age category).
- We now also increased the number of volunteers per image to 3
You can see examples and further information in the tutorial, which can be found in the Classify section
Do I have to include the comma?
That is up to you. For example, "3,555", can be entered as "3,555" or "3555". Commas were used as thousand separators to make values easier to read. Commas should always be followed by three digits. This can help to distinguish them from points in poor quality snippets, and to separate values which are 'squashed' due to limits on space. Commas aren't necessary for our processing, so we remove them. It's up to you if you want to include them or not. You can see more examples in the tutorial, which can be found in the Classify section
Do I need to include any decimal points?
Yes please do. Please enter exactly what you see, so "20.00" should be entered as "20.00" (Not 20). Numbers with decimal points will only ever have two digits after the decimal point. You can see more examples in the tutorial, which can be found in the Classify section
What is the best way to enter numbers without using the mouse
Enter the number > Click Tab > Click Tab > Click Enter
If you are using a tablet or a mobile, we recommend that you use a mobile keyboard.
Can I use a mobile device?
Yes, the website is mobile-friendly and it works quite well for our project. You can consider getting a special software keyboard that always displays numbers (e.g. SwiftKey for Android with number row enabled or NumPad for iOS)
Some of the images are very clear, I don’t understand why the OCR hasn’t identified them?
We have completed some work to compare values, and this highlights inconsistencies. For example, if we have a table where we have recorded the number of Males as 10, females as 12, and “All people” as 30 - we know one of these figures is incorrect. Some of the OCR results look fine, but we know that the sum of Males and Females should equal “All people”, as such there is an error. We have an algorithm that identifies the most likely places for these errors, and feed these counts into Zooniverse. We identify the inconsistencies in a number of ways:
- Comparing values within tables, e.g. ensuring that the “all people” value is the sum of all of the individual age bands
- Comparing identical values between tables, for example a value for “all females” will appear in numerous tables.
- Comparing values of a higher geography with the sum of all of the lower geographies (e.g. the values for Hammersmith, should be the sum of all of the Hammersmith wards)
These checks allow us to identify any inconsistencies and target Quality Assurance work effectively, so we are only asking people to check what really needs to be checked.
What do the numbers mean, can you give me some context?
Each number refers to a characteristic of the number of people or households for a particular area. We can’t tell you exactly what each snippet refers too, that is part of the work. Please refer to the about page, for information regarding the topics covered in the 1961 Census, this also gives further background information such as a link to the 1961 Census form. Once results become available, we will make these data available.
The images I am seeing all say “Already seen” / “Finished” – what should I do?
If you are seeing images labelled "Already seen" and "Finished!" then it is likely you have checked everything that needs to be checked. We will be uploading new batches of data from time to time, so please do come back.
Why does the percentage on the completed projects keep going up and down?
We are constantly uploading new data and assign it to new workflows (this makes the export of completed data much easier and faster). We deactivate and eventually hide finished workflows so that they don't clog up the statistics page. Unfortunately this leads to the "% complete" bar going up and down as you noticed.
We hope that's not a big problem. There's a list of all completed workflows in the "Results" page.