


Finished! Looks like this project is out of data at the moment!
Thank you for your efforts! This project's classification effort is complete! To browse other active projects that still need your classifications, check out zooniverse.org/projects
Research

Introduction
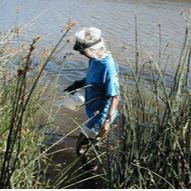
How is the quality of the water changing? Is it getting better? Is it getting worse? Are all the efforts of municipalities, state, federal and tribal communities are making to improve water quality working? A thoughtful water quality monitoring program can help answer these critically important questions. Elkhorn Slough and the surrounding wetlands comprise a highly eutrophic estuarine ecosystem in Monterey County in central California. These wetlands have been altered by human activities, including diking, harbor construction, and agriculture. Here at the Elkhorn Slough National Estuarine Research Reserve (ESNERR)together with the Elkhorn Slough Foundation (ESF) and the Monterey County Water Resources Agency we have been supporting a volunteer water monitoring program since 1988. Check out our web page here. Among the oldest water quality monitoring programs in the state twenty-six stations (see map) are sampled monthly for temperature, salinity, dissolved oxygen, pH, turbidity, nitrate, ammonium, and dissolved inorganic phosphate. The data are collected in the field from 1988 - 2004 by a singularly dedicated and reliable volunteer, Sue Shaw, along with assistance from many student volunteers. Today dedicated volunteers, students, and staff participate to collect the samples.

Nutrients and Algae and Hypoxia oh MY!
 What lurks beneath!

Excess nutrients in a system causes excess algal growth which in turn leads to poor water quality and hypoxia (oxygen levels so low many animals can not survive). This process is know as eutrophication. Eutrophication is a global problem. We hope to learn more about solutions to decrease the deleterious effects of eutrophication on the ecosystem.
How Zooniverse Volunteers will help this project
Check out our water quality report card here. We use all the data we collect from Dissolved oxygen, turbidity, pH, nutrient concentrations as well as percent cover of algae to calculate one single score (water quality index). The problem is we didn't record percent cover of algae in these older photos. We need these numbers to get a better representation of water quality in the past. The only way to do that is to look at the old photos and estimate if from them. To go through all of these years of photos individually is too cumbersome and this is where you come in. Your help will greatly improve our understanding of water quality in the past and how it has changed to the present day.