


Research
Help us determine if tracings of galaxy spiral arms are clustered correctly
The goal of this project is to organize the collected spiral galaxy arm tracings contributed by Spiral Graph volunteers (a previous project on the Zooniverse platform also led by this research team) and gather them into individual arms. Our algorithm[1] automatically groups, or clusters, tracings together to indicate individual arms, but it's not always right. We need your help to judge if the algorithm produced correct results.
Your classifications will be used to train an A.I. that we are developing. The A.I. will select the appropriate parameters for clustering tracings into individual arms and your contributions will make our A.I. more effective!
What's the difference between an algorithm and A.I.?
An algorithm uses a fixed set of rules or steps to solve a problem. It follows rigid logic, it does not learn, and it produces consistent and predictable results for the same input. An A.I., on the other hand, is a simulation of human intelligence. It can modify its approach to a problem, it learns and improves automatically with added data, and the results can vary based on the likelihood of various possible outcomes.
Why is identifying individual spiral arms in a galaxy important?
(If you are unfamiliar with galaxies, check out the short learning modules linked on our Education page. Specifically, Module 2 discusses different types of galaxies and their features.)
Spiral galaxies are not always symmetric and their individual arms may differ in shape from each other. The three example galaxies below may appear symmetric at first glance, but their arms are actually different from each other. Some are longer, some are bifurcated, and some have a different pitch angle (a measure of how tightly wrapped a spiral arm is; see our FAQ page for a description of pitch angle).
NGC 1300 | M 101 | PGC 1212361 |
|---|---|---|
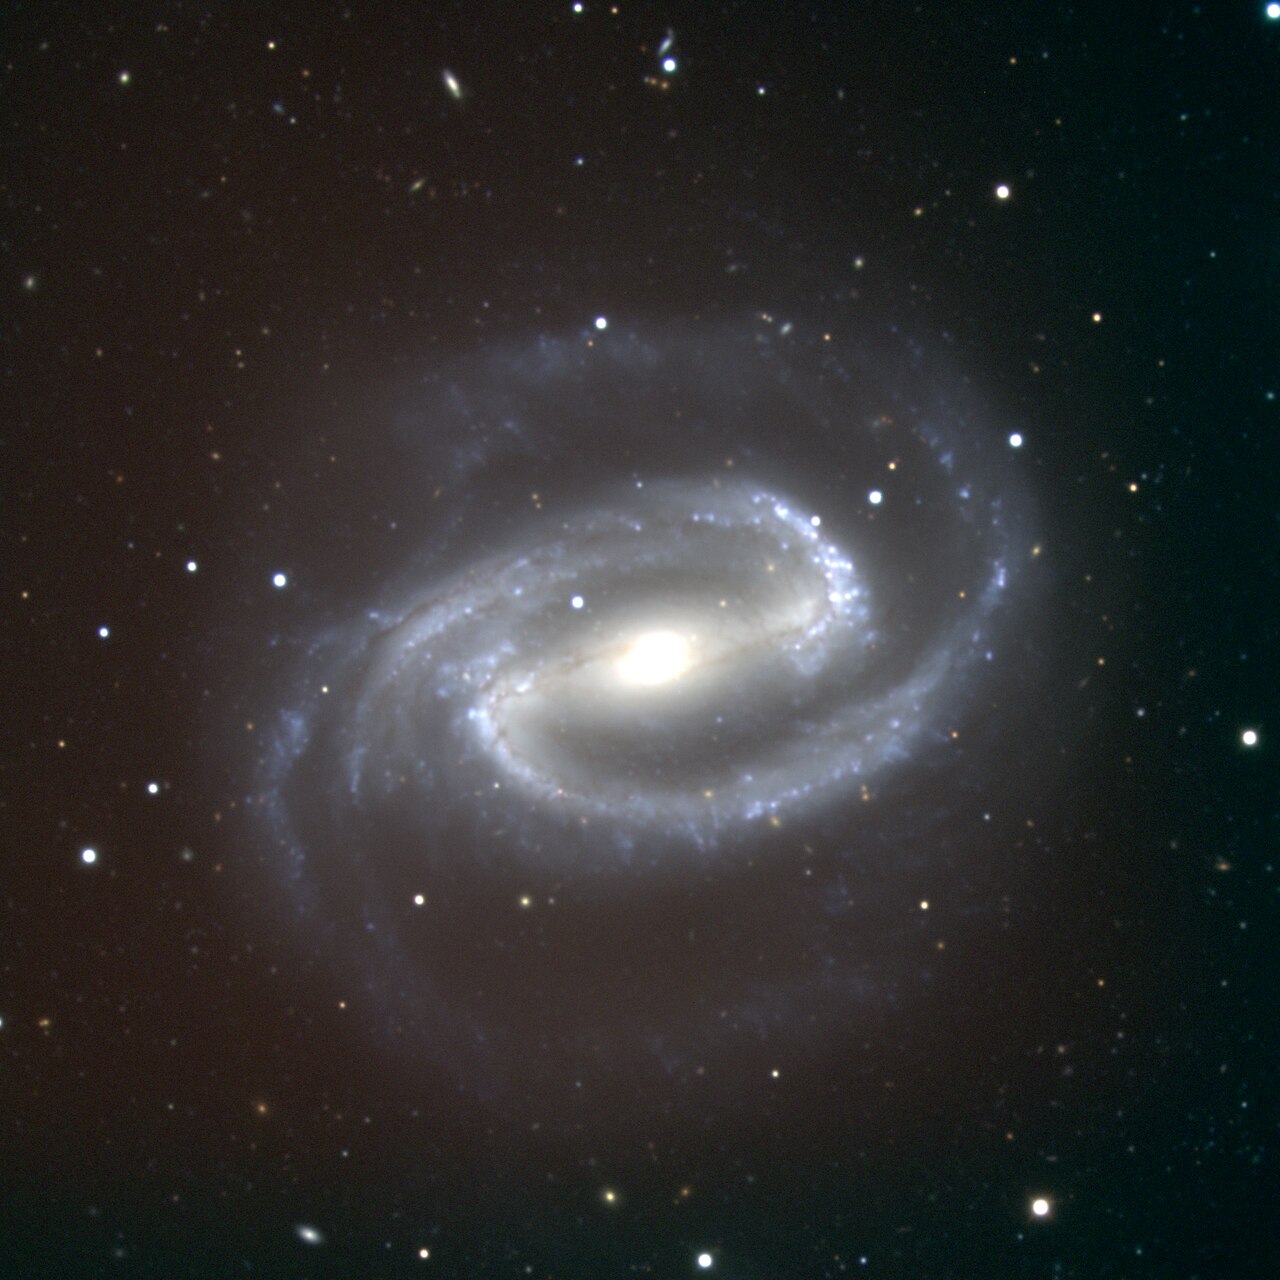 | 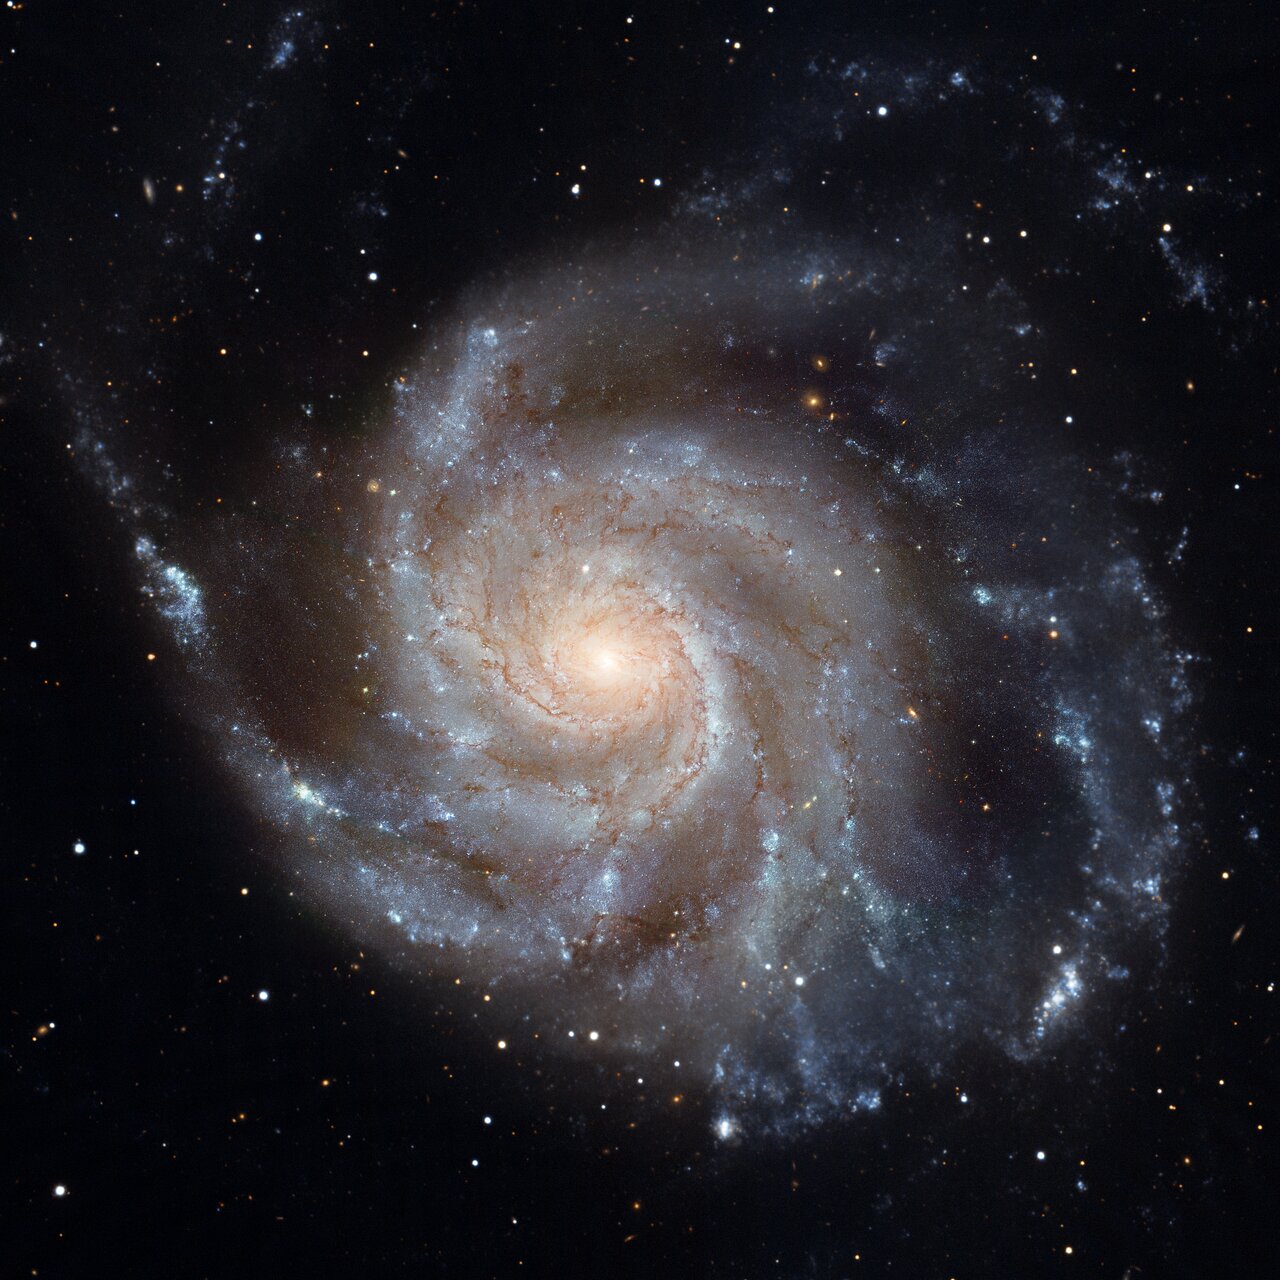 |  |
Our pitch angle measurement software, P2DFFT[2], assumes the input image is perfectly symmetric. This means that if a full image of a spiral galaxy is input to the software, it assumes the arms are logarithmic spirals of equal length and pitch angle, with each arm's starting position evenly spaced around the galaxy. Measuring the pitch angle of each arm individually, rather than all together, lets us bypass this assumption of symmetry.
How you can help
We need you to judge whether or not our clustering algorithm correctly grouped tracings together into individual arms.
The Task
1. First, you will be shown a set of figures.
- (A) One figure will be the overlay of a color image on a gray scale image. The gray scale image shows the aggregated set of tracings of the galaxy's arms, obtained from multiple different volunteers in Spiral Graph. The color image is the result of our algorithm's attempt at grouping the tracings into individual arms, while ignoring any outliers. Each of the colors represents a different cluster of tracings or different arm.
- (B) The second figure only shows the color image of our algorithm's clustering attempt with each color representing a different cluster of tracings.
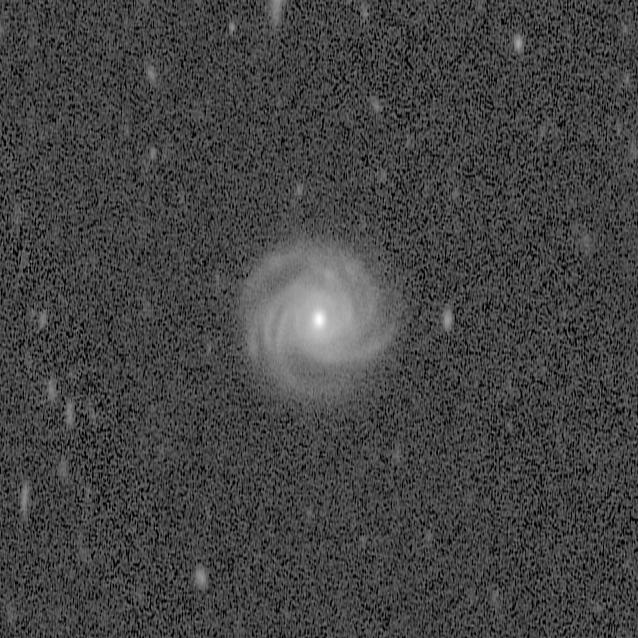
- (C) The final figure only shows the gray scale image of the aggregated arm tracings from Spiral Graph volunteers.
(A) Overlay Image | (B) Clustered Image | (C) Aggregated Tracing Image |
|---|---|---|
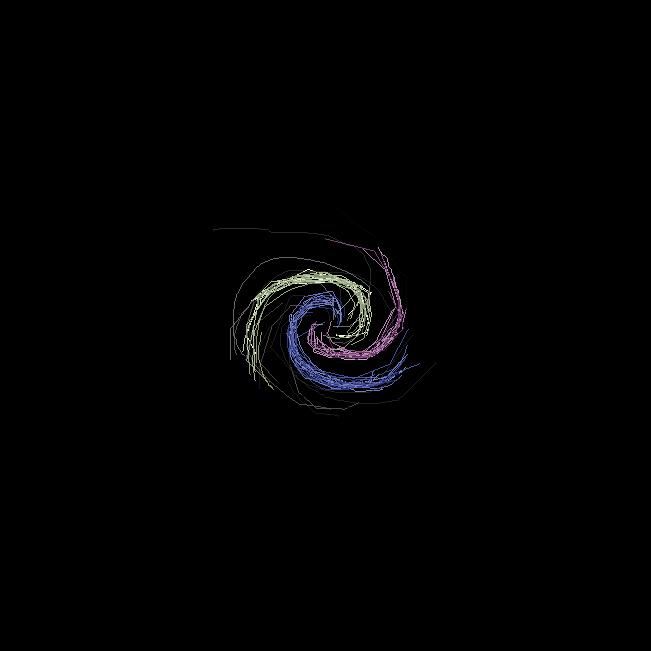 | 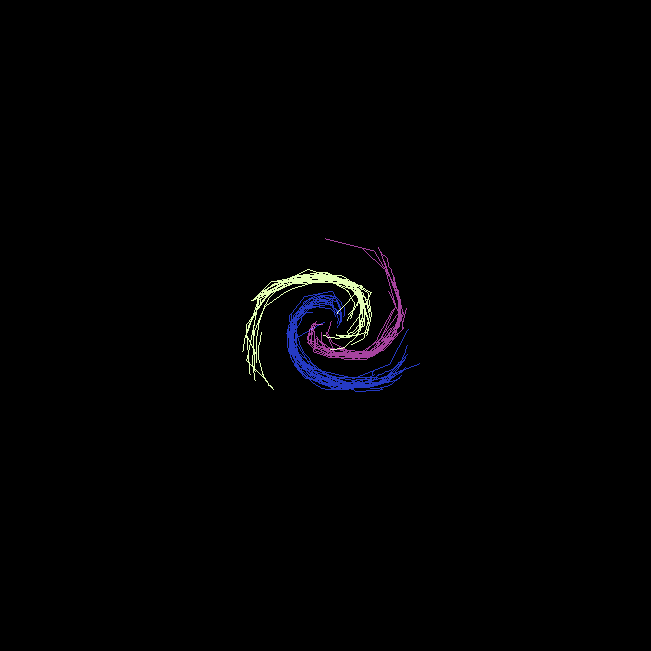 | 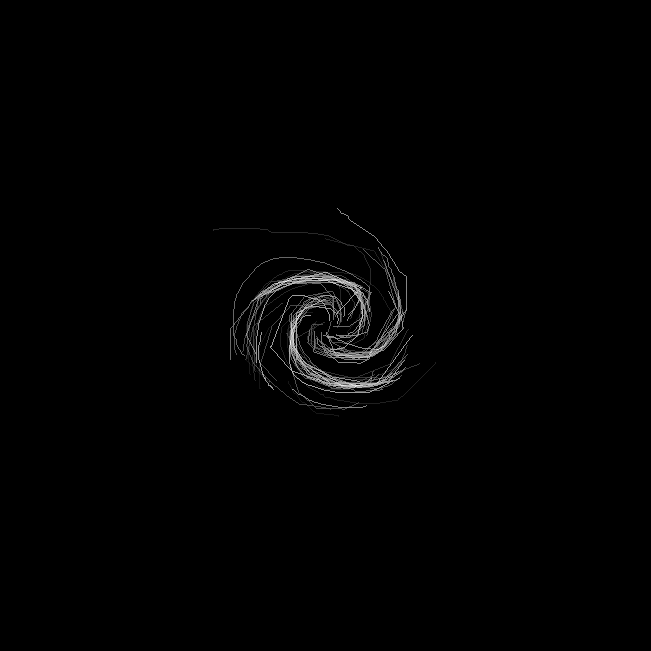 |
2. Then you will be asked "Do the tracings appear to be clustered correctly into individual arms?" You simply have to use your best judgement and select Yes or No!
The Impact
We will use your judgement classifications to train a new A.I. system we are creating. This A.I. will help us choose the right settings for our clustering algorithm based on the combined tracing image. Our properly tuned clustering algorithm will let us group the tracings into separate arms more accurately and allow us to measure the pitch angle of each one. We hypothesize that this will help us more accurately determine the overall pitch angle of non-symmetric galaxies.
Why is measuring pitch angle important?
The pitch angle of spiral arms relates to other parameters of the host galaxy that are more difficult and time consuming to measure. These parameters include the mass of the black hole found in the nucleus[3], bulge stellar mass[4], galaxy total stellar mass[5], maximum rotational velocity, and dark matter content of the galaxy[6]. By measuring the spiral arm pitch angle we can quickly and easily estimate these parameters and identify interesting galaxies for more detailed, follow-up telescope observations.
For example, we can use pitch angles to search for rare black holes in the centers of large galaxies. These rare black holes, with masses that range from hundreds to hundreds of thousands of times the mass of our Sun, are known as intermediate mass black holes. Almost all large galaxies have central supermassive black holes with masses that range from millions to billions of times the mass of our Sun. By first discovering and then studying galaxies with intermediate mass black holes, we can learn more about how spiral galaxies like our own Milky Way have evolved.
This project is supported by NASA's Citizen Science Seed Funding Program[7].
See https://alptezbasaran.github.io/ncam25/#/3 for a simple flow diagram that outlines how our clustering algorithm works. ↩︎
P2DFFTis a parallelized code that applies two-dimensional fast Fourier transformations to images of spiral galaxies in order to isolate and measure the pitch angles of their spiral arms. The latest version of the code can be found at https://doi.org/10.5281/zenodo.3165700. ↩︎Treuthardt, P., Tezbasaran, A., & Hewitt, I. (2024). Spiral Graph: Cluster Buster - A Participatory Science Project to Improve the Identification of Spiral Arms from All-Sky Survey Galaxy Images. Zenodo. https://doi.org/10.5281/zenodo.15882378 ↩︎