


Finished! Looks like this project is out of data at the moment!
New FISHstory findings are available! Updated results from the FISHstory project are now available on our Results page. Curious to learn more? You can also dive deeper into the findings to date by checking out a recording of a recent seminar featuring the FISHstory team.
Take a look and explore what we’re learning from these historic fisheries photos thanks to all of you!
Results
The FISHstory project wouldn’t be possible without so many amazing partners and volunteers. So first off – we wanted to thank you for all of your hard work and valuable contributions to this project! Data analysis is still underway, but wanted to share a summary of key findings to date. We'll be adding more information as we complete additional analyses in the upcoming months.
Project Key Findings to Date
The FISHstory project had three main components: digitizing and archiving historic photos, describing for-hire catch rates via Zooniverse, and developing a method to estimate fish size in the photos. Key findings from these components are highlighted below.

Historic Photo Overview
The photos in the FISHstory project help describe the beginning of the for-hire fishery in the U.S. South Atlantic. The graphs below provide an overview of the historical photos archived through the project. Over 2,300 photos were digitized and archived as part of this project. Approximately 85% of the photos archived can be used for analysis. The photos that can't be used directly for analysis still provide important documentation of the historic fishery and are used in project outreach and promotion.
The photo dates ranged between 1935 – 2003. Photos represented trips taken from all months with the most photos between April and August likely mimicking the effort across vessels in this fishing fleet.

Photos archived through the project spanned from the Outer Banks of North Carolina through the Florida Keys with the large majority of photos (96%) from the state of Florida.

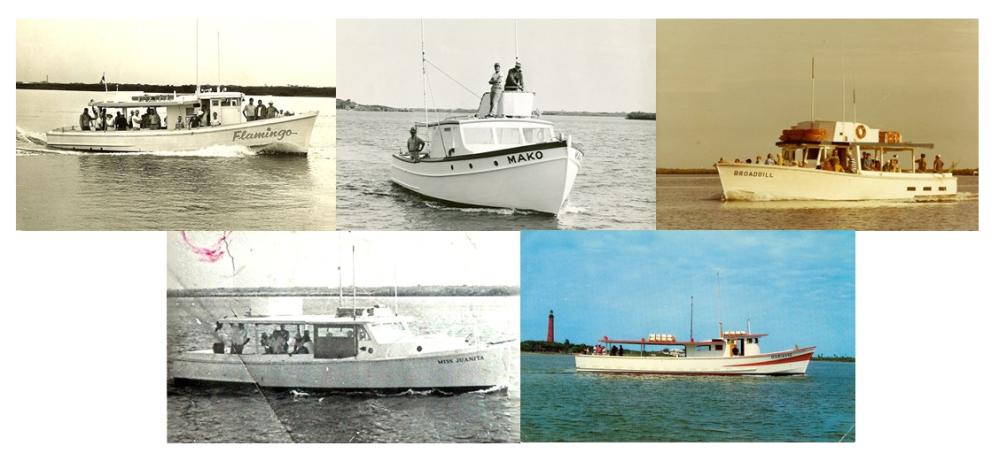
At least 62 vessels were represented in the photos. However the majority of photos (72%) were from five main vessels: the Flamingo, the Mako, the Broadbill, the Miss Juanita, and the Marianne.
Species Catch Rates
FISHstory originally launched as a pilot project on Zooniverse in 2020–2022. Based on what we learned during the pilot, we adjusted the workflows before relaunching in 2024–2025 to make classification simpler and improve data quality. Since the relaunch, Zooniverse volunteers have classified 1,054 unique photos, and a Validation Team of fish identification experts reviewed a subset of these to help verify identifications.
Because different volunteers don't always agree, and even careful observers can miss a fish or misidentify one, the FISHstory analytical team built a model that accounts for this. It separates the true, unobserved number of fish in each photo from the imperfect way people report what they see — including things like missed detections, mistaken identifications, and differences between expert and volunteer counts. By modeling observer behavior this way, the team can combine repeated counts from many volunteers and experts into a single, more reliable estimate.
The result is an annual relative index of abundance, with a measure of uncertainty attached to it, for each species. These indices have currently been developed for King Mackerel and Red Snapper. The analytical team is currently working to develop indices for additional species.


Length Component
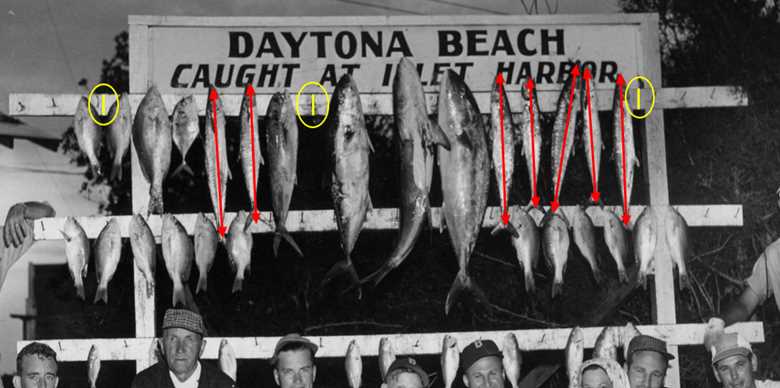
Outside of Zooniverse, the FISHstory team developed a method to estimate fish size in the photos using the open-source software, Image J. The method developed uses the lumber in the fish leaderboards as a scale. An illustrated example of completed length measurements from a FISHstory photo are in the figure below. The yellow lines represent scalar measurements of the lumber. The red lines represent fish measurements. The pixel measurements from the scalar were used to estimate the size of the fish.
To date, all archived historic photos containing King Mackerel and Red Snapper have been measured, and length compositions have been developed for both species. The graphs below present length compositions for King Mackerel and Red Snapper by decade from the 1950s through the 1970s. These decades were selected because they had the largest photo sample sizes, providing sufficient data to generate length compositions.


Key Takeaways & Next Steps
The methods developed through the FISHstory project for archiving and analyzing historic photos have shown tremendous promise. Volunteers (like all of you!) made valuable contributions to the project in multiple ways - contributing photos, classifying photos, assisting with data validation, and measuring fish. Together, these efforts are helping us better understand the size and type of fish species that were caught during this historic time period. Exploring fisheries of the past through these photos can help us better understand the health of fish stocks today and into the future.
A big milestone for FISHstory happened recently when the project's Red Snapper length data were presented during the South Atlantic Red Snapper stock assessment process. Stock assessments are scientific analyses used to estimate the health and status of fish populations. During the assessment's Data Workshop, experts review available data sources and recommend which datasets should be included in the assessment. The FISHstory Red Snapper length data were recommended for use at the Data Workshop. While the stock assessment is still underway and decisions about how and if the data will ultimately be used may evolve, this recommendation represents an important step forward and demonstrates the value of the work made possible by our volunteers, partners, and collaborators.
Looking ahead, we're continuing to work on expanding the geographic coverage and time period represented in the FISHstory archive, exploring ways to improve the efficiency of our workflows, and developing additional fisheries data products, including abundance indices and length compositions for more species.
We're also actively pursuing additional funding to continue growing FISHstory. We're grateful to all of you for helping make the FISHstory project what it is today!
Interested in hearing more about the FISHstory project?
The National Oceanic and Atmospheric Administration's (NOAA) Library will be hosting a seminar on the FISHstory project on August 12, 2026 at 2pm EDT. The presentation will provide an overview of the project, highlight some of the historic data that has been gathered through the project, and give thanks to the amazing group of folks who have contributed to the project. A link to a recording of the seminar is available on NOAA Library's YouTube page.