


Please leave us your feedback using this short Google form https://goo.gl/forms/88KTExjVQ9B1s1kw1
Research
Our Mission
Welcome to Planet Finders. With your help, we can discover new planets around stars outside of our own Solar System!
The recently launched Transiting Exoplanet Survey Satellite (TESS) is providing us with a huge amount of data that lets us look for planets outside of our own Solar System. Over the next two years TESS will be busy surveying two-hundred-thousand bright nearby stars, measuring and recording their brightness every two minutes. With your help, we hope to uncover lots of interesting planetary systems, allowing us to explore the formation and evolution of these worlds. Our findings may even bring us one step closer to answering the question that we all seek to answer: Are we alone in the Universe?
You could be the first person to discover a planet around a nearby Star in the Galaxy! Want to give it a try?
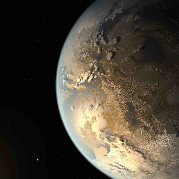
What is an Exoplanet?
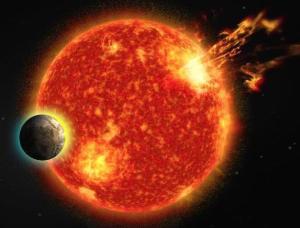
Photo credits: Nora Eisner (star adapted from NASA image)
Exoplanets are planets beyond our own Solar System that orbit stars other than the Sun. The drastic improvement in telescopes in the last 50 years has enabled us to find thousands of exoplanets since the first one was discovered in the late 20th century. Whilst many of these found exoplanets resemble the planets found in the Solar System, we have also come across strange systems including gigantic planets in orbits close to their star (called Hot Jupiters) and planets that orbit multiple stars (circumbinary planets).
How do we detect Planets?
TESS records how the brightness of individual stars varies over time. This time series of brightness measurements is known as a lightcurve. When an exoplanet passes, or transits, in front of its host star, the star momentarily dims and we see a dip in its lightcurve. This method of detecting planets is known as the Transit Method and has already proven to be extremely effective.
Here is a simplified example of what the lightcurve from a transit looks like. It shows that as the planet passes in front of its host star, the light that we receive on Earth decreases.
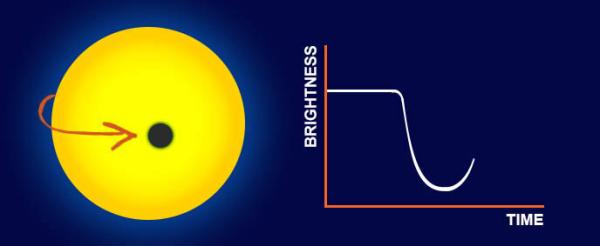
Photo credits: Nora Eisner
In order for us to be able to observe a transit we require the planetary system to be oriented so that the planet passes between us and the host star (as shown on the right hand side of the image below). If this is the case, we will see a dip every time that the planet completes one full orbit around the star. If the planet does not cross our line of sight, we will miss the transit (shown on the left).
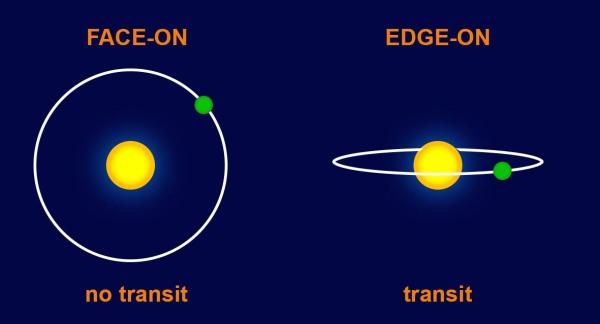
Photo credits: Nora Eisner
The size of the dip in the lightcurve depends both on the size of the star and on the size of the planet. First, for a single sized star, if the transiting planet is larger it will block out more starlight, and thus the dip in the lightcurve will be larger. Conversely, for the same sized planet, if the star is larger (for example a G dwarf life the Sun) the transit will be shallower than if the star is smaller (for example an M dwarf).
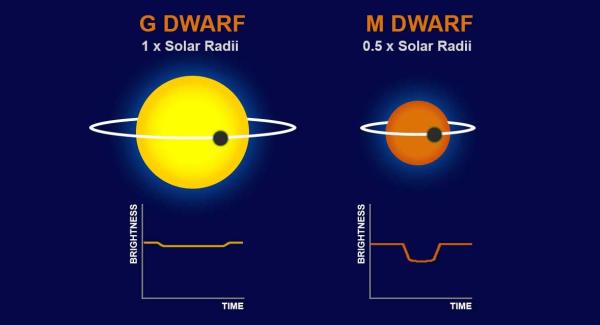
Photo credits: Nora Eisner
In our Solar System we have eight various sized planets. It therefore should come as no surprise that other stars can also host multiple worlds. The lightcurves of these exoplanetary-systems would show multiple transits from the different planets, which would likely have different depths due to their different sizes. They are also likely to be separated irregularly, as different planets orbit around stars at different rates - just like the planets in our Solar System where Jupiter takes 12 times longer than Earth to complete one orbit. An example lightcurve is shown below. If you see a multi-planet system, please highlight all the transits that you see.

Stars
The vast majority of stars are not alone, but instead exist in double, or even triple systems of stars that orbit around one another. When one of these stars passes in front of another (as seen by us), the brightness that we observe changes, similar to what happens during a planet transit. This is known as an eclipsing binary. Lightcurves due to an eclipsing binary will often exhibit two different sized dips.

If you do see a lightcurve with an eclipsing binary, please mark this as a transit and tell us about it in Talk.
Stellar Variability
To complicate things further, we also see changes in brightness due to the variability of the star. The surface of a star is made up of hotter (brighter) and colder (dimmer) patches. As the star rotated (as all stars do), these patches or starspots also rotate, resulting in periodic fluctuations in the observed brightness. These variations tend to be slow and smooth, typically occurring over a couple of days. Conversely, we expect planets to transit at a much quicker pace, in just a few to tens of hours, resulting in narrower dips in the lightcurves.
Stars can also pulsate. This is when the radius of the star changes over time, and thus the brightness fluctuates. This effect ranges from being very rapid, on the timescales of a few hours, to extremely low, on the timescale of years.
More on TESS
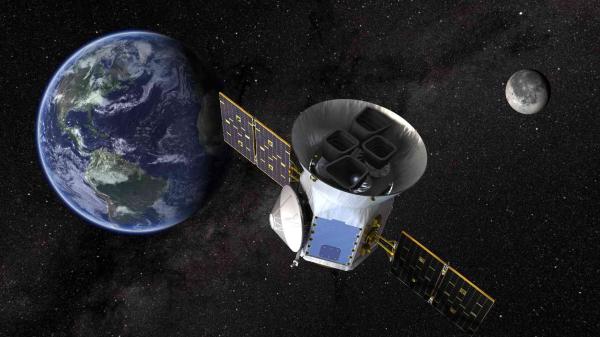
Photo credits: Nasa's Goddard Space Flight Center
TESS launched on April 18, 2018, aboard a SpaceX Falcon 9 rocket, and now orbits around the Earth at twice the rate of the Moon. Over the next two years, this amazing new satellite will observe the entire sky by breaking it up into 26 different sectors. Each sector is stared at by four extremely powerful cameras, together covering a patch of sky with dimensions of 24 by 96 degrees. You can find out exactly where the satellite is pointing at this link. The stars in each of these sectors will be monitored for at least 27 days, recording their brightness every 2 minutes.
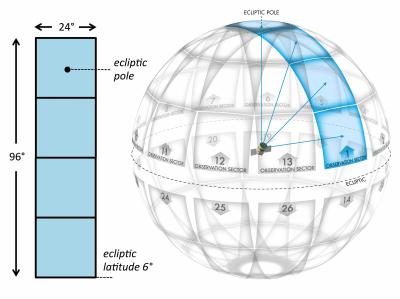
Photo credits: Nasa's Goddard Space Flight Center
Watch this video to find out more about how TESS works:
Focus Event
All the data collected by TESS will be sent back to Earth every two weeks (half way through one observation cycle). During the time of transmission, which lasts about 4 hours, the conditions of the satellite can change slightly - e.g. due to changes in temperature of the equipment - which may result in a brief glitch in the data, which we are calling a focus event. This can show up in the lightcurves as highlighted in the figure below.

Simulated Data
The TESS data has not yet been released and we are, therefore, showing you simulated data. This data was made to replicate the 'real' TESS data as closely as possible, and is based on what we already learned from the previous Kepler mission. The good thing about this simulated data is that we know everything about it such as how many planets there are in each lightcurve (if there are any), if there are eclipsing binaries, or how variable the star is.
One of out primary goals from the Planet Finders project is to find out more about the diversity of planets, and to understand what kind of solar systems exist. We will find many planetary systems with Planet Finders, but in order to correctly interpret our results we need to understand how complete our sample is. For example, very small planets are very difficult to find and we might not see any in the TESS data, but this does not mean that they do not exist. The results from the simulated data will help us understand what kind of planets can been found from looking at the lightcurves by eye, and will, therefore, help us statistically understand the population of planets.
The results from this beta test will not only help us understand the real data when it is released, it will also let us improve the Planet Finders interface so we can successfully find as many planets as possible.
Why we need you
Scientists from around the world have developed extremely efficient computer algorithms that will look for repeated signals in TESS's lightcurves. Such techniques have already proven to be extremely efficient at finding planets, however there is only so much that a machine can do. Planetary systems are highly complex, and their lightcurves are never quite the same. This, combined with the variability of the stars, can confuse our computer algorithms, yielding wrong results or missing planetary systems entirely. Human brains, however, are excellent at detecting patterns that automated routines may miss, and that is why we need your help!
To date, Planet Finders volunteers found over 100 new planetary systems in the Kepler data, and we are excited to find even more with the TESS data. Will the next planet be discovered by you?