This project has been built using the Zooniverse Project Builder but is not yet an official Zooniverse project. Queries and issues relating to this project directed at the Zooniverse Team may not receive any response.
You will be given a plot of a "light curve" showing flickering X-rays from a black hole star system. Does the the light curve show oscillations? If so, mark the peaks and troughs of the oscillation (high and low points). If there are also slower "heartbeat" oscillations, mark those as well. Flag unusual behavior. If there are too many oscillations in the plot to analyze, let us know and we will break up the plot as we develop the project.
Zooniverse Talk
Chat with the research team and other volunteers!
Black Hole Zoo Statistics
View more statsKeep track of the progress you and your fellow volunteers have made on this project.
Every click counts! Join Black Hole Zoo's community to complete this project and help researchers produce important results. Click "View more stats" to see even more stats.
By the numbers
Message from the researcher
Connect with the research team on Talk to learn more about this project!
About Black Hole Zoo
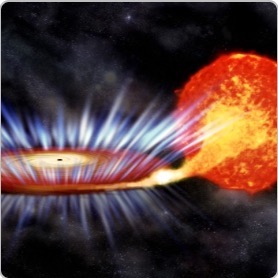
The Rossi X-ray Timing Explorer collected months of data of flickering X-rays from the black hole system GRS 1915+105. This enigmatic star system probably contains a black hole together with a normal star.
By identifying the peaks and troughs (low points) of individual quasi-pulses, marking each irregular oscillation, you can help us break the spectrum down based on oscillation phase.
This project was first tested by these Clayton State ASTR 1020L students in Fall of 2015:
Kandi Baker
Richard Bell
LaKeyshia Coney
Pearline David
Mikal Davis
James Deeds
Celecea Dorsey
Ademola Gbadehan
Keisha Grant
Robert Hamilton
Alyssa Hart
Nicholas Mathis
Jonathan Mensch
Huie Nguyen
Corey Noble
Alyssa Osborne
Parth Patel
Donna Price
Chan Thu Thach
Darkeea Tusie
Eric Williams
In later stages of this project, we will add data on other black hole systems such as Cygnus X-1, and data from other X-ray telescopes.