We want to learn more about who is interested in Redshift Wrangler and how we can best support your contributions. Please take a few minutes to fill out our participant survey - your feedback will be so useful as we continue to grow and improve!
Research
Welcome to Redshift Wrangler! In our project, we're using spectroscopy, the study of light, to learn more about distant galaxies and the early universe. This page will help you get started - once you've learned about light and galaxies and the cosmic timeline, you'll be ready to head over to the "Classify" tab and start working with real data. Let's dive in!
How do we use galaxies to look back in time?
In astronomy, the closest we get to operating a time machine is using telescopes to look at light traveling across the universe. The light from distant galaxies takes time to reach us, and by the time it arrives at Earth, it tells us not only what galaxies looked like so long ago, but, more importantly, what was happening inside of them and how they developed into the kind of galaxies we see today, including the one we call home.
So, if we spot a galaxy with our telescopes, how can we tell which time period we're looking at? The key is to start with a timeline of our universe over cosmic history...
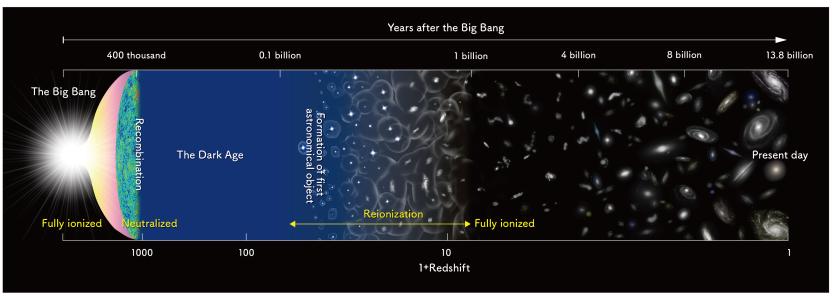
This timeline describes how galaxies have changed since the first galaxies formed nearly 14 billion years ago. We can better understand the universe and our place within it by studying these far away systems - which is really studying our universe's dark past! The timeline above begins with the Big Bang on the left and progresses forward in time as we track how many billions of years have passed along the top. The marker along the bottom tracks redshift (which we'll get into below) and indicates the distance from us. There’s a time period in the early universe called reionization, shown in yellow along the bottom, where matter in the universe went from being overall neutral to being fully ionized. Since that time period, the universe has been overall transparent, allowing light from distant galaxies to reach us. (For more info on reionization: check out NASA's resources on the Early Universe). This type of cosmic timeline helps us connect time and space - the left side of the timeline represents long ago in the past AND far away in space.
But why should we care what's happening far out in space? The oxygen you breathe, the carbon you are made of, and the iron that flows in your blood all come from elements in space that are part of the cosmic story of stars forming, living, and dying in galaxies. Learning about the elements in galaxies not only allows us astronomers to learn about how stars and galaxies develop, but also learn more about where we came from and our place in the cosmos.
Check out a video introduction to our team's research and this project!
The Story So Far
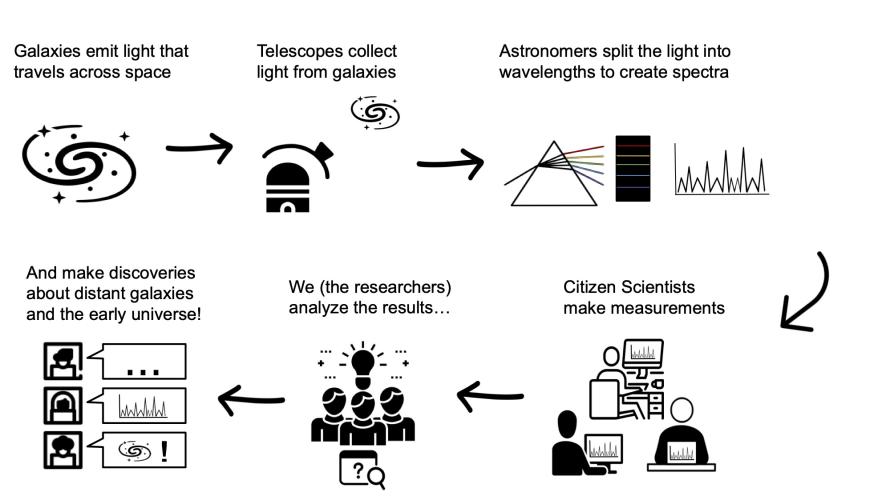
How can we even study galaxies that far away?
To study these galaxies, we use the most important tool we know of and one of the ONLY tools astronomers have to learn about anything far away from us. Light!
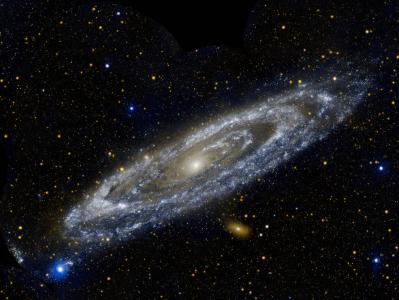
We can take an image of a galaxy like Andromeda, our closest neighbor, that looks like this:
But for our project, we are most interested in something called a spectrum (plural: spectra). In a spectrum, the light from an object (like a distant galaxy!) is spread out (in visible light, we call this a rainbow) and works kind of like a fingerprint of elements. A spectrograph on a telescope works like a prism to spread light out into a range of colors, or wavelengths:
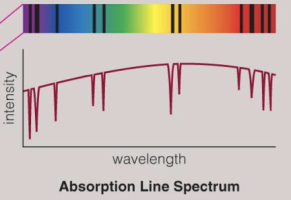
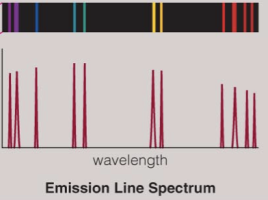
By looking at the spectrum of a galaxy, we can identify the fingerprints of different materials and determine what elements are present. You can see spectral features as peaks called emission lines, or dips called absorption lines that occur at different wavelengths. Different elements have peaks and dips that always occur at the same places, like having a fingerprint. By tracking down those characteristic patterns, we can identify which elements are present.
These images show matching emission and absorption spectra (showing brightness vs wavelength). In the images, the rainbow panel along the top is called the "2D spectrum" and the red line on the graph below is called the "1D spectrum." One way to think of it is that the 2D spectrum is like a picture and the 1D spectrum is a graph.
How do we determine how far away galaxies are?
We use something called cosmological redshift, the stretching of light waves due to the expansion of the universe. You may have experienced the Doppler effect in sound waves before. Have you ever noticed how a truck honking its horn or the siren on an ambulance sounds higher in pitch when it's traveling towards you and lower in pitch when it's receding? We hear a higher pitch when sound waves are compressed, and we hear a lower pitch when the truck passes us as if the sound is being stretched out. Cosmological redshift describes a similar effect in which light waves, instead of sound waves, are shifted in frequency. In this case, the movement of the truck away from us that makes the siren sound lower in pitch translates into the stretching of light waves as galaxies are pulled away from each other by the expansion of space itself. We measure redshift in light waves by looking at the spectrum of light. We search for the characteristic patterns of emission lines and determine how far they've been shifted from where we expect.
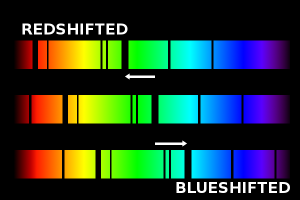
In this example, the spectrum in the middle shows emission lines for an object that isn't moving towards or away from us. The redshifted spectrum above it would be observed if that object were moving away from us, and the blueshifted spectrum below would be observed if that object were moving toward us.
Using redshift measurements, we have been able to measure the motion of distant galaxies with respect to us and discover that the universe is expanding! Everything in the universe is slowly moving away from all other objects at speeds we can actually measure from their spectra. Measuring a greater redshift in a galaxy's spectrum means the galaxy is very distant, and exactly how redshifted it is helps us calculate a precise distance.
How does astronomy help us look back in time?
Looking out in space is like looking back in time. The speed of light is the ultimate speed limit, but it still takes time to travel from one point in the universe to another. If a galaxy is millions or billions of light years away, it will take the light millions or billions of years to reach us. When light from a distant galaxy arrives at Earth, the galaxy may look different than when that light left. The light we observe tells us about how objects looked in the past, when the light we receive left that galaxy. Measuring distances in space is one of the most challenging but fundamental tasks in astronomy. Because of the relationship between space and time, the distance to a far away galaxy can tell us what point in the universe's history we are peering into and piece together how galaxies have changed over time.
Where do you come in?
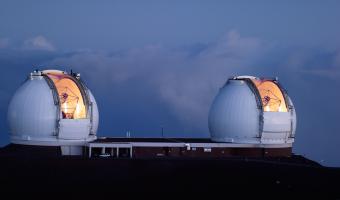
Using the spectra of hundreds of thousands of galaxies we have collected from telescopes like the Keck Observatory on Mauna Kea and the Hubble Space Telescope, we need your help to pick out key features.
In this project, you will be identifying spectral features (emission and absorption lines) in a set of spectra of distant galaxies to help us find out which elements are present and determine the galaxies' redshifts. Each measurement you make will help us locate the galaxies on the timeline of cosmic history below. The image shows a timeline of how galaxies have looked and evolved over time into how they exist now. Each galaxy we observe fits somewhere on this timeline; you will be the one to help us figure out where!
Your Tasks
Our project involves two complementary tasks for participants: Task 1: Identifying Emission Lines in a spectrum and Task 2: Checking Spectral Fits. This example image shows what the data for each will look like:
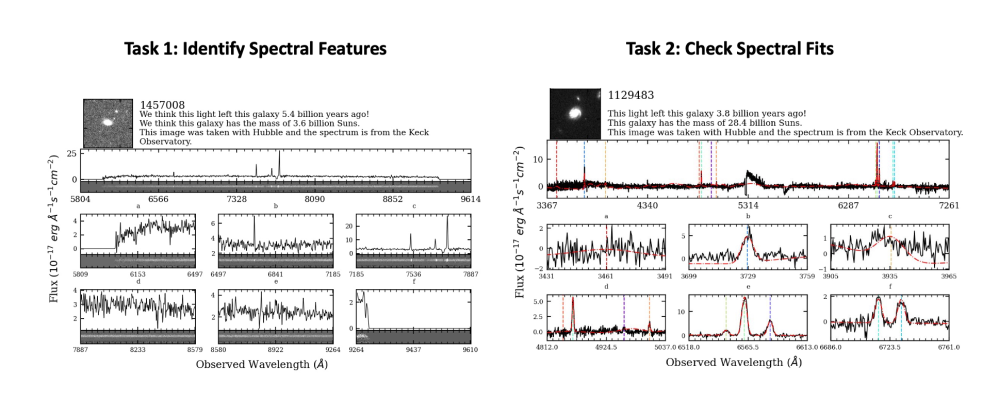
You will be guided through a tutorial instructing you on what to look for before working with real data. In the first task, you will learn to distinguish between background noise and emission lines (those spiky peaks in the data), and in the second you learn to look for patterns to determine whether a fit we've placed over the spectrum matches it well (does the red line match the black line?). We need you to help us look through all of these data because even with automated methods generating fits like these, we still require human eyes to check how good the fits are and look for problems we may need to fix (as well as to measure the precise redshift in the first place!). Your identification of spectral lines and inspection of automated fits will provide us with the necessary information to find out information like the distances to these galaxies and their chemical composition!
What will we do with the results?
Once we identify key features in the spectra with your help, we can calculate redshifts for our galaxies and use them for a number of projects. With your help confirming emission lines, we will also be able to estimate important properties related to these galaxies: like the rate at which they are forming stars, what their chemical composition looks like, and how their central supermassive black hole behaves. From there, we can address questions like how galaxies and their surrounding gas are related to the large scale structure of the universe, how supermassive black holes contribute to their galaxy's evolution, and how Dark Energy drives the acceleration of the universe's expansion.
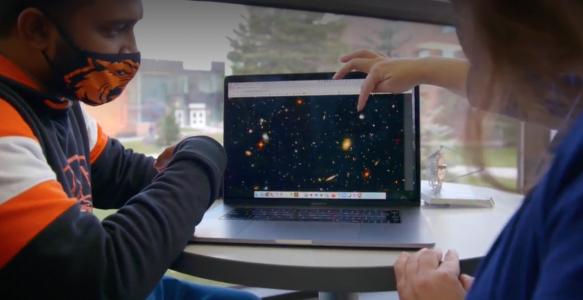
Image credit: RIT News
We welcome scientists and non-scientists alike to join our Redshift Wrangler team - and we hope our project is especially accessible and attractive to those who aren't trained professionals!
How to get started
To select a task in Redshift Wrangler, navigate to the main page of our site (you can click on "Redshift Wrangler" next to our logo at the top of the page) and look for Task 1 or Task 2 under "Get Started". You may also see a "Task 1 Sandbox" task, which is identical to Task 1 but helps us add classifications to our nicer, less noisy DEIMOS data. The sandbox is a good place to start if you're a beginner or want to practice the same task with simpler spectra. You can also jump in to whichever task you worked on last by clicking on the "Classify" tab. Check out the Tutorial button to see examples, or follow the link below for a short video tutorial. Before you watch the video, you may want to check out the rest of our page and try the walk-through tutorial in "Classify" tab first, then return here when you have questions. You can also bring up the Field Guide at any time by clicking on the narrow banner on the right side of your screen next to the scroll bar. If you still need help, send us your questions in the "Talk" tab.
Join us and make important measurements using state-of-the art astronomical facilities on the ground and in space! Happy Wrangling ...

Image credit: Serina Lin
This work is funded by NASA and NSF. Find other information about NASA Citizen Science Projects here: http://science.nasa.gov/citizenscience